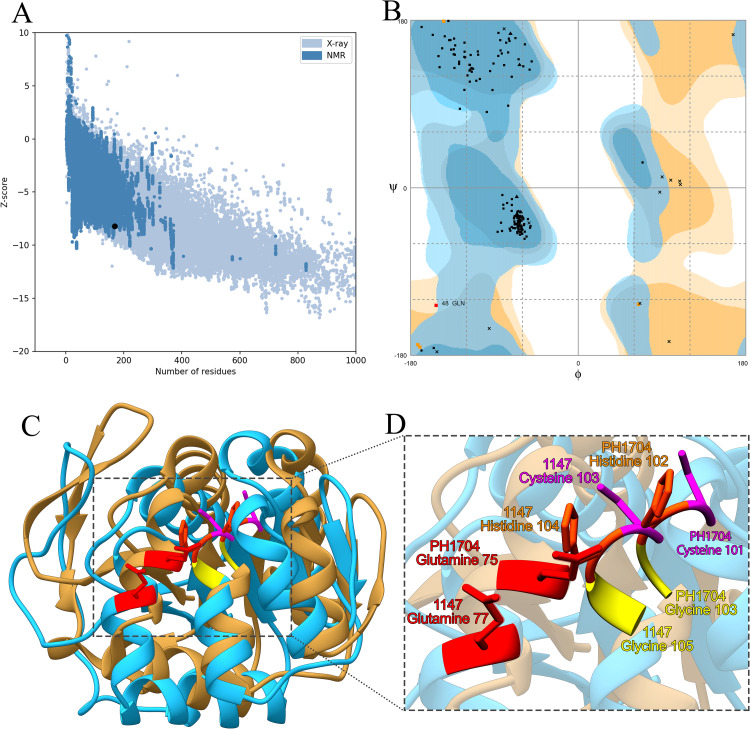
Fig 3. The validation of homology modeling results.
(A) ProSA Z-score analysis for homology modeled protease 1147. The plot showed that the black spot (predicted model) with the Z-score value of -6.34 is within the range of native conformation of all proteins chains in PDB determined by X-ray crystallography or NMR spectroscopy concerning their length. (B) Ramachandran's analysis depicts that 98% of residues fall within the favoured, allowed, and acceptable regions, while the outlier region represents only 2%. (C) The 3D superimposition between the native structure of Pyrococcus horikoshii chain A (beige) and predicted protease 1147 structure (blue). The RMSD is 0.51 Å. (D) Catalytic tetrad residues are shown and labeled.

