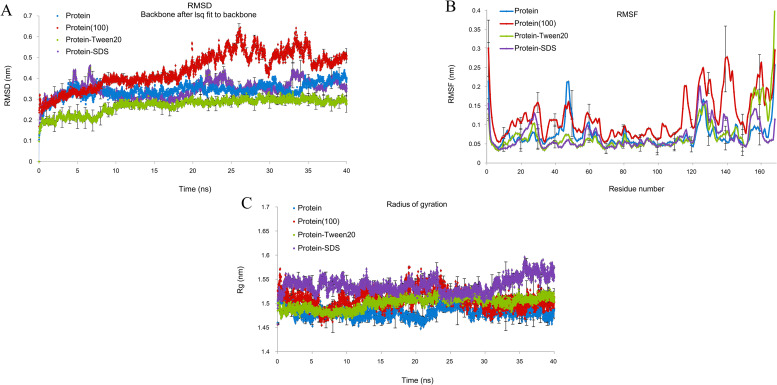
Fig 7. MD simulation of protease 1147 alone and in complex with Tween 20 and SDS.
(A) RMSD graph, (B) RMSF graph, and (C) Rg Protease 1147 in the water environment (black), protease 1147-Tween20 complex (green), protease 1147-SDS complex (blue) and protease 1147 at 100°C temperature. The approximate positions of active site amino acids are shown in the RMSF plot. The simulations were run in triplicate to obtain average values. The error bars represent standard deviations and are depicted for every 10 ps.

