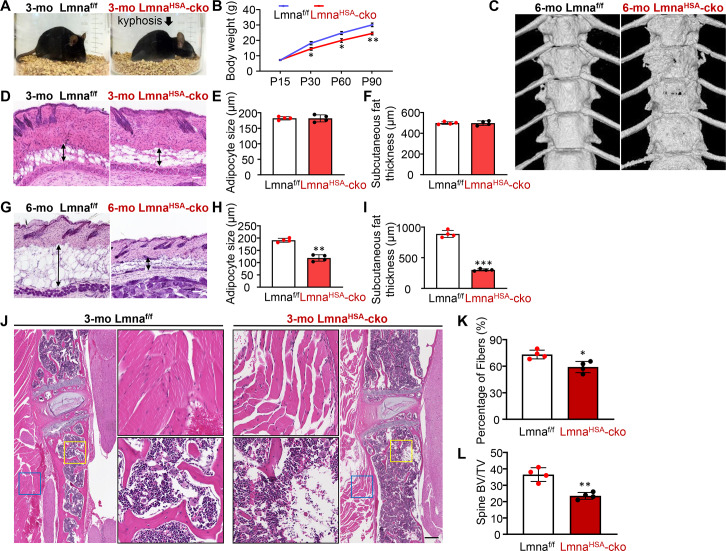
Fig 1. Laminopathy-like phenotypes in muscle-selective Lmna-KO mice.
(A) Kyphotic-like phenotype in 3-mo LmnaHSA-cko mice. Shown are representative images of mice with the indicated genotype. The control mice are littermates, Lmnaf/f. (B) Age-dependent decrease of body weight in LmnaHSA-cko mice. *P < 0.05, **P < 0.01. (C) Representative μCT images of thoracic spines of 6-mo Lmnaf/f and LmnaHSA-cko mice. (D and G) Representative images of HE-stained skin sections from Lmnaf/f and LmnaHSA-cko mice at of 3 mo (D) and 6 mo (G). Scale bar, 200 μm. (E,F,H,I) Quantification of adipocyte size and subcutaneous fat thickness in Lmnaf/f and LmnaHSA-cko mice at 3 mo (E,F) and 6 mo (H,I). The values shown are means ± SD (n = 4 animals per genotype). **P < 0.01, ***P < 0.001. (J) Representative images of spine muscle fibers and bone by HE staining analysis. Scale bar, 200 μm. (K,L) Quantification analyses of data in (J). The percentage of muscle fibers (K) and the spine trabecular BV/TV (L) were presented. The values shown are means ± SD (n = 4 animals per genotype). *P < 0.05, **P < 0.01. The underlying data for this figure can be found in S1 Data. μCT, microcomputer tomographic; BV/TV, bone volume over total volume; cko, conditional knockout; HSA, human alpha-skeletal actin; KO, knockout; Lmna, lamin A/C gene; Lmnaf/f, floxed Lmna mice; LmnaHSA-cko, skeletal muscle–specific Lmna-cko mice; mo, months old; P, postnatal day.

