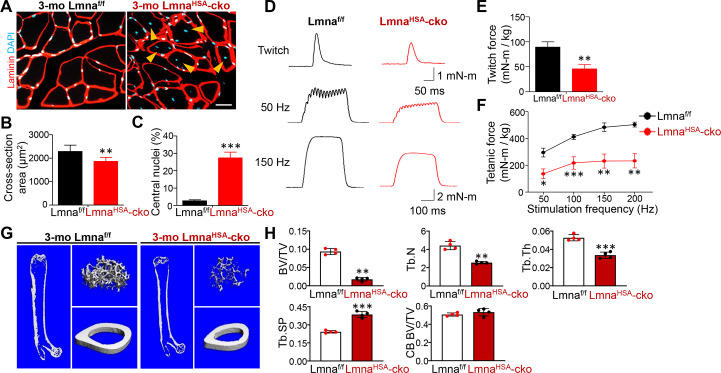
Fig 2. Decreases in muscle size, muscle force, and TB mass in 3-mo LmnaHSA-cko mice.
(A) Representative images of gastrocnemius cross sections. Scale bar, 20 μm. (B,C) Quantification analyses of cross-section area and central nuclei distribution. The values shown are means ± SD (n = 5 animals per genotype). **P < 0.01, ***P < 0.001. (D) Representative twitch curves and tetanic curves at stimulation frequencies 50 and 150 Hz by muscle stimulation in LmnaHSA-cko mice. (E,F) Quantification analyses of twitch force and tetanic force. The values shown are means ± SD (n = 4 animals per genotype). *P < 0.05, **P < 0.01, ***P < 0.001. (G) Representative μCT 3D images of femurs from 3-mo Lmnaf/f and LmnaHSA-cko littermates. (H) Quantification analyses of TB BV/TV, Tb.N, TB.Th, Tb.Sp, and CB BV/TV by direct model of μCT analysis. Data are shown as means ± SD (n = 4 male mice of each genotype, examined blindly). **P < 0.01, ***P < 0.001, significant difference by two-way ANOVA. The underlying data for this figure can be found in S1 Data. μCT, microcomputer tomographic; BV/TV, bone volume over total volume; CB, cortical bone; cko, conditional knockout; HSA, human alpha-skeletal actin; KO, knockout; Lmna, lamin A/C gene; Lmnaf/f, floxed Lmna mice; LmnaHSA-cko, skeletal muscle–specific Lmna-cko mice; mo, months old; TB, trabecular bone; Tb.N, TB number; Tb.Sp, TB space; TB.Th, TB thickness.

