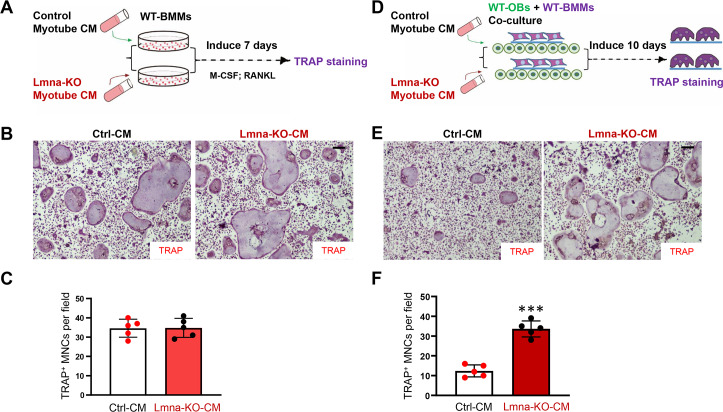
Fig 4. Increased osteoclast differentiation in coculture system in the CM of Lmna-KO myotubes.
(A) The experimental treatment strategy. WT BMMs were treated with CMs of Ctrl or Lmna-KO myotubes. (B) The representative images of TRAP staining. Scale bar, 100 μm. (C) The quantitative data of TRAP+ MNCs. (D) Experimental strategy. WT OBs and WT BMMs were treated with CM of Ctrl or Lmna-KO myotubes for 10 days. (E) Representative images of the cultures treated with CM for 10 days. Scale bar, 100 μm. (F) The quantitative analyses of TRAP+ MNCs per field. The values shown are means ± SD from five different cultures. ***P < 0.001, significant difference from the Ctrl. The underlying data for this figure can be found in S1 Data. BMM, bone marrow macrophage/monocyte; CM, conditioned medium; Ctrl, control; KO, knockout; Lmna, lamin A/C gene; M-CSF, macrophage colony-stimulating factor; MNC, multinucleated cell; NF-κB, nuclear factor kappa-light-chain-enhancer of activated B cells; OB, osteoblast; RANKL, receptor activator of NF-κB ligand; TRAP, tartrate-resistant acid phosphatase WT, wild-type.

