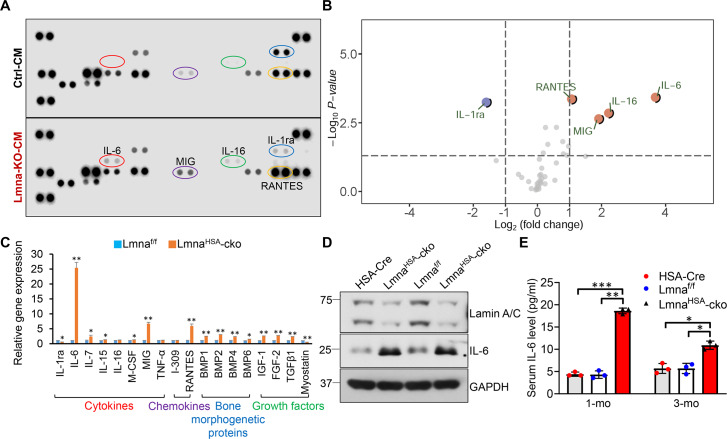
Fig 5. Increased expression levels of IL-6 in Lmna-KO myotubes and in muscles and serum samples of LmnaHSA-cko mice.
(A) Proteome profile of Mouse Cytokine Array of CM of Ctrl and Lmna-KO myotubes. (B) Volcano plot comparing Log2 (fold change). Up-regulated proteins were marked in red, and down-regulated proteins were indicated in blue (P < 0.05). (C) Real-time PCR analysis of gene expression in muscles of 1-mo Lmnaf/f and LmnaHSA-cko mice. *P < 0.05, **P < 0.01, significant difference. (D) Western blot analysis of IL-6 expression in muscles of 1-mo HSA-Cre, Lmnaf/f, and LmnaHSA-cko mice. GAPDH was used as the loading Ctrl. (E) ELISA analysis of serum IL-6 level in 1-mo and 3-mo HSA-Cre, Lmnaf/f, and LmnaHSA-cko mice. *P < 0.05, **P < 0.01, ***P < 0.001, significant difference. The underlying data for this figure can be found in S1 Data. BMP, bone morphogenetic protein; cko, conditional knockout; CM, conditioned medium; Cre, cyclization recombination enzyme; Ctrl, control; GAPDH, glyceraldehyde-3-phosphate hydrogenase; HSA, human alpha-skeletal actin; IL, interleukin; KO, knockout; Lmna, lamin A/C gene; Lmnaf/f, floxed Lmna mice; LmnaHSA-cko, skeletal muscle–specific Lmna-cko mice; M-CSF, macrophage colony-stimulating factor; MIG, monokine induced by gamma interferon; mo, months old; RANTES, regulated on activation, normal T cell expressed and secreted; TGF, transforming growth factor; TNF, tumor necrosis factor.

