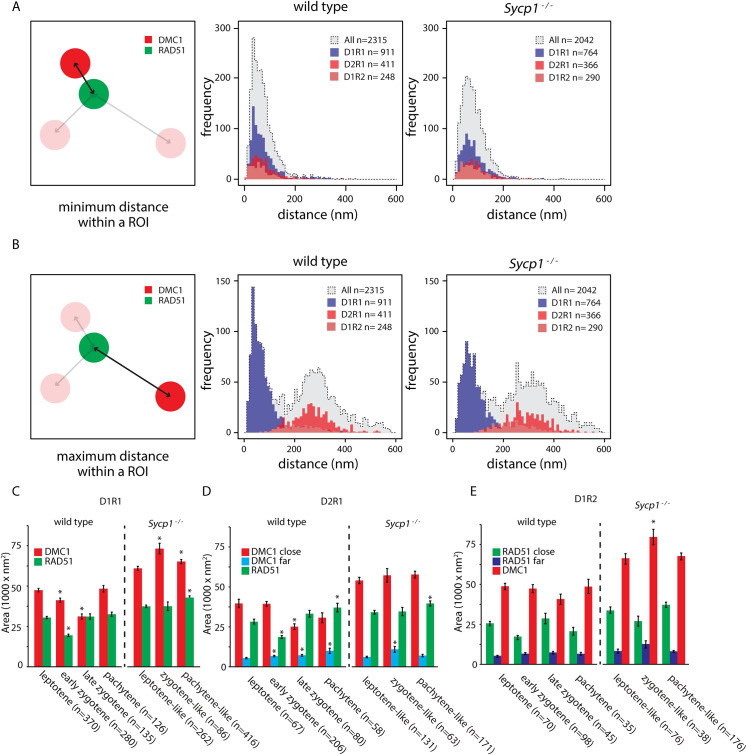
Fig 5. Distances between DMC1 and RAD51 nanofoci, and area occupancy.
A) Distribution of the minimum distances between the center of mass of RAD51 and DMC1 nanofoci in wild type (middle panel) and Sycp1-/- (right panel) foci. Dashed lines with grey fill represent all foci, the D1R1, D1R2 and D21R1 subgroups are depicted in blue, light red, and red histograms, respectively. B) As in A) but maximum distances are depicted. C) Area of RAD51 and DMC1 nanofoci in D1R1 subgroup. Error bars indicate SEM, asterisks indicate significant difference compared to leptotene (p<0.05). n indicated number of foci. D) As in C) but area of RAD51 and DMC1 close and far nanofoci in D2R1 subgroup are shown. E) As in D) but area of RAD51 and DMC1 close and far nanofoci in D1R2 subgroup are shown. p-values can be found in S2 Table.

