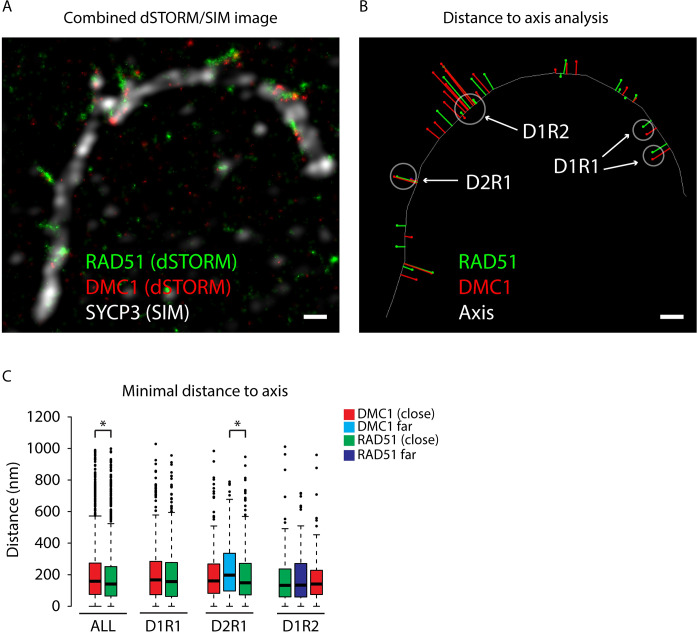
Fig 6. Distance of RAD51 and DMC1 nanofoci to the axial and lateral elements of the SC.
A) Combined dSTORM and SIM image of a segment from a synapsed pachytene nucleus immunostained for RAD51 (green), DMC1 (red), and SYCP3 (white). B) The same area of the nucleus is shown, but here the immunosignals have been replaced by a line for SYCP3, and by dots indicating the centers of mass for RAD51 (green) and DMC1 (red). The red and green lines represent the measured distances. An example of regions where nanofoci distances were measured for D1R1, D1R2, and D2R1 foci are indicated (note that distances from another more complex ROI intersperse with the D1R2 distances). Size bars represent 500 nm. C) Box plots of minimal distances (nm) of all RAD51 and DMC1 nanofoci as well as the distances of the nanofoci of the separate D1R1, D2R1, and D1R2 classes to the axial or lateral elements in zygotene and pachytene nuclei, colour code explained in the figure. Asterisks indicate statistical significant differences, p-values are in S2 Table, the boxed region depicts the data from the first quartile to the third quartile and the whiskers extend +/- 1.5x the interquartile range (IQR = Q3-Q1; minimum value = 0). Data points lying outside this region are depicted as individual points (outliers). All DMC1 n = 1606, all RAD51 n = 2141, D1R1 n = 421, D2R1 n = 265, D1R2 n = 124.

