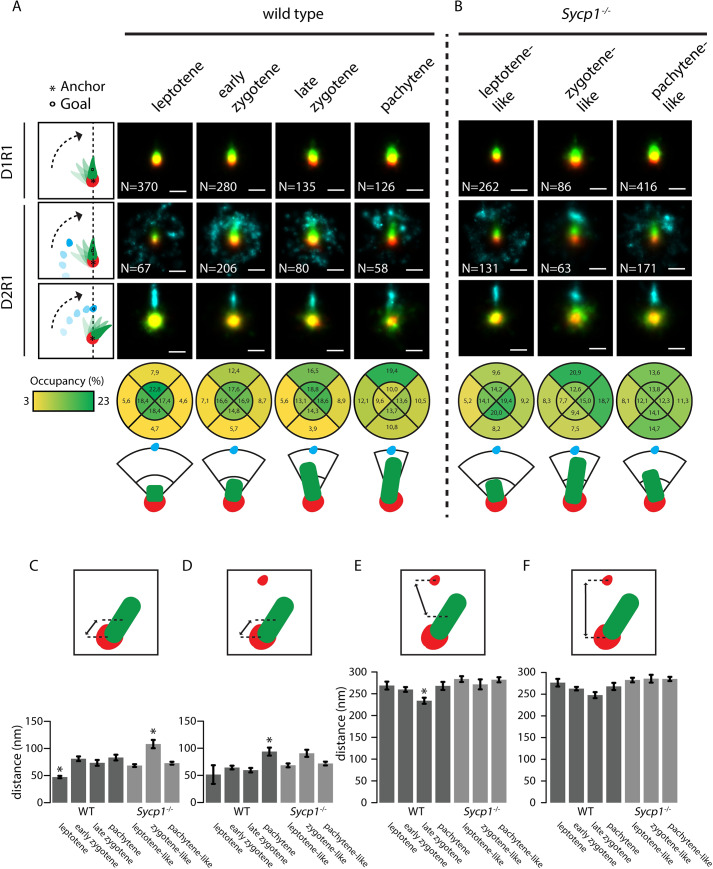
Fig 7. Consensus patterns of D1R1 and D2R1 during meiotic prophase in wild type and Sycp1-/- spermatocytes.
Summed images of all rotated and aligned foci within the D1R1 and D2R1 group in wild type (A) and Sycp1-/- (B) per stage. Images were rotated as indicated by schematic drawings to the left of each row, whereby the anchor (*) indicates the nanofocus that is centred, and the goal (o) the nanofocus that is rotated to align along the axis. Underneath the lowest D2R1 row, the percentage of localisations for the RAD51 nanofocus in each indicated quadrant area is shown for each stage for the rotation whereby the close-DMC1 is used as anchor and the far-DMC1 as goal. A schematic interpretation of the results of the rotations is also shown. (C-F) Mean distances between the indicated nanofoci per stage in wild type and Sycp1-/- spermatocytes. Error bars indicate SEM. Asterisks indicate significant difference compared to all other stages (p<0.05). Scale bars represent 100 nm. p-values can be found in S2 Table.

