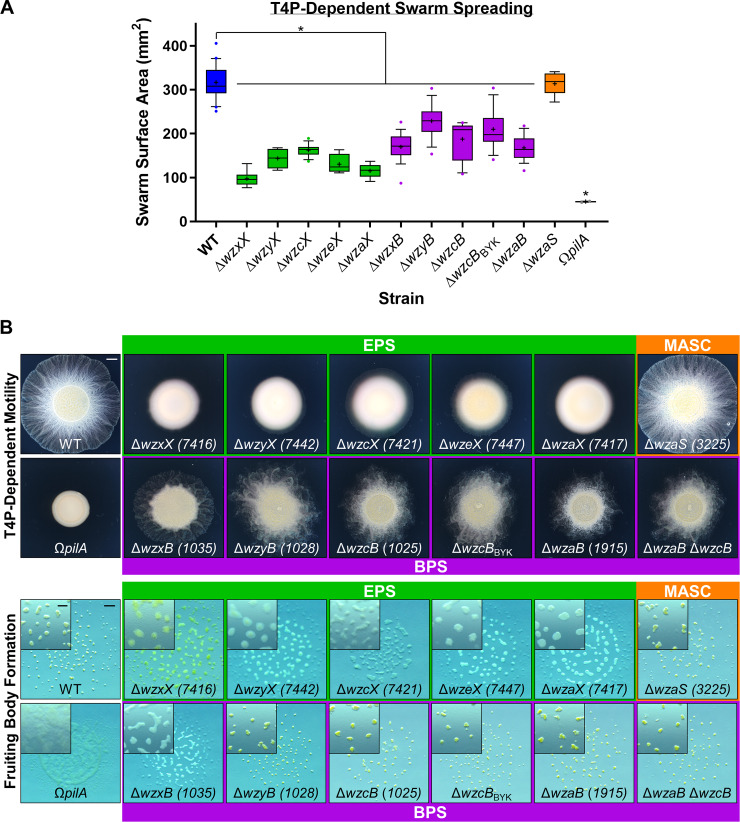
Fig 2. Physiological defects due to loss of EPS versus BPS.
(A) Box plots of the swarm surface obtained on 0.5% agar from T4P-dependent motility after 48 hours. The lower and upper boundaries of the boxes correspond to the 25th and 75th percentiles, respectively. The median (line through center of boxplot) and mean (+) of each dataset are indicated. Lower and upper whiskers represent the 10th and 90th percentiles, respectively; data points above and below the whiskers are drawn as individual points. Asterisks denote datasets displaying statistically significant dataset differences (p < 0.05) compared with WT, as determined via 1-way ANOVA with Tukey’s multiple comparisons test. A minimum of 4 biological replicate values were obtained, each the mean of 3 technical replicates. Raw values and detailed statistical analysis are available (S1 Data). (B) EPS-, MASC-, and BPS-pathway mutant swarm physiologies. Top: T4P-dependent motility after 48 hours (scale bar: 2 mm). Bottom: Fruiting body formation after 72 hours (main panel, scale bar: 1 mm; magnified inset, scale bar: 400 μm). BPS, biosurfactant polysaccharide; EPS, exopolysaccharide; MASC, major spore coat; T4P, type IV pilus; WT, wild type.

