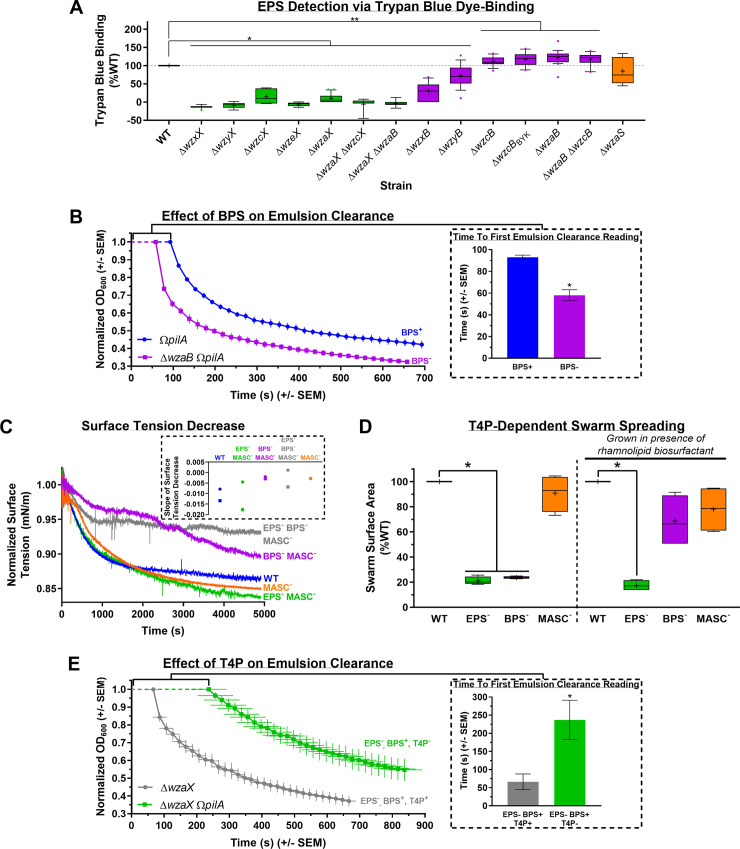
Fig 3. Analysis of BPS properties.
(A) Boxplots of trypan blue dye retention to indicate the levels of surface-associated polysaccharide production in various strains relative to WT. The lower and upper boundaries of the boxes correspond to the 25th and 75th percentiles, respectively. The median (line through center of boxplot) and mean (+) of each dataset are indicated. Lower and upper whiskers represent the 10th and 90th percentiles, respectively; data points above and below the whiskers are drawn as individual points. Asterisks denote datasets displaying statistically significant differences in distributions (p < 0.05) shifted higher (**) or lower (*) than WT, as determined via Wilcoxon signed-rank test performed relative to “100.” Raw values and detailed statistical analysis are available (S2 Data). (B) Real-time clearance of hexadecane–CYE supernatant emulsions from BPS+ and BPS− strains; values are the mean of 3 biological replicates (+/− SEM). OD600 values were normalized to their first registered values, whereas registered time points are displayed at their actual occurrence. Inset: Scanning time (post-mixing) for a given cuvette (containing a culture supernatant–hexadecane emulsion) until a first absolute value for OD600 could be registered by the spectrophotometer, for samples with(out) BPS (n = 3). Asterisk (*) denotes statistically significant difference in mean value compared with pilA mutant (p = 0.0031), as determined via unpaired Student’s t test. Raw values and detailed statistical analysis are available (S2 Data). (C) Time course of normalized surface tension values (via digital-drop tensiometry) from representative submerged-culture supernatants. Surface tension values across all time points were normalized against the initial surface tension value (t = 0) for each respective strain (S3C Fig). Strains tested: WT, MASC− (ΔwzaS), BPS− MASC− (ΔwzaB ΔwzaS), EPS− MASC− (ΔwzaX ΔwzaS), EPS− BPS− MASC− (ΔwzaX ΔwzaB ΔwzaS). Inset: Slope values from biological replicate time courses (each represented by a different shape) for each strain. Slopes were calculated by fitting the time-course curves with a fourth-degree polynomial function. Raw values are available (S3 Data). (D) T4P-dependent swarm spreading in the presence of exogenous di-rhamnolipid-C14-C14 biosurfactant from Burkholderia thailandensis E264. The lower and upper boundaries of the boxes correspond to the 25th and 75th percentiles, respectively. The median (line through center of boxplot) and mean (+) of each dataset are indicated. Lower and upper whiskers represent the 10th and 90th percentiles, respectively. Asterisks denote datasets displaying statistically significant differences in mean values (p < 0.05) compared with WT swarms, as determined via 1-sample t test performed relative to “100.” Raw values and detailed statistical analysis are available (S1 Data). (E) Real-time clearance of hexadecane–CYE supernatant emulsions from T4P+ and T4P− BPS-producing strains; values are the mean of 3 biological replicates (+/− SEM). OD600 values were normalized to their first registered values, whereas registered time points are displayed at their actual occurrence. Inset: Scanning time (post-mixing) for a given cuvette (containing a culture supernatant–hexadecane emulsion) until a first absolute value for OD600 could be registered by the spectrophotometer, for samples with(out) a functional T4P (n = 4). Asterisk (*) denotes statistically significant difference in mean value compared with ΔwzaX (p = 0.0265), as determined via unpaired Student’s t test. Raw values and detailed statistical analysis are available (S2 Data). BPS, biosurfactant polysaccharide; CYE, casitone-yeast extract; EPS, exopolysaccharide; MASC, major spore coat; OD600, optical density at 600 nm; T4P, type IV pilus; WT, wild type.

