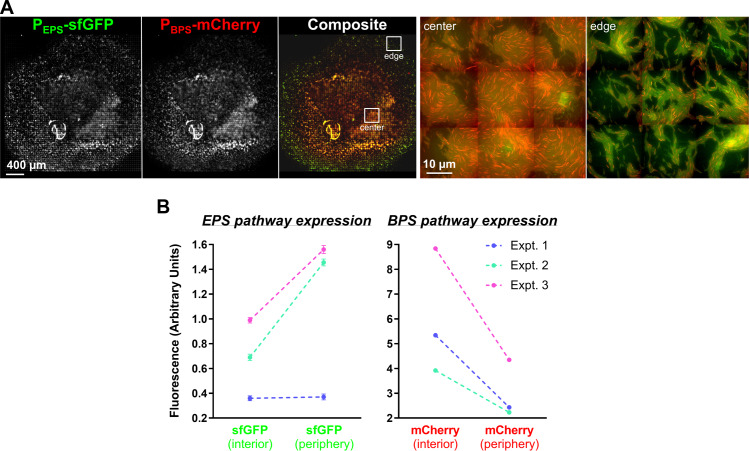
Fig 6. Analysis of the spatial expression of the EPS and BPS gene clusters.
(A) Dual-labeled (PEPS-sfGFP + PBPS-mCherry) WT cells (strain EM709) from exponentially growing cultures were spotted on developmental media at a final concentration of OD600 5.0 and imaged at 48 hours. Images were scaled as described in “Material and methods.” The 2 images on the right are magnified views of the colony center and colony edge at positions approximately indicated by the inset boxes in the composite image. (B) Flow cytometry analysis of WT + PEPS-sfGFP + PBPS-mCherry cells harvested from the colony interior or periphery following incubation for 48 hours. Cells were analyzed for intensity of sfGFP and mCherry fluorescence. Results of 3 independent experiments are displayed (first experiment, blue lines; second experiment, green lines; third experiment, magenta lines). For each experiment, a total population of 300,000–500,000 events was used and statistically analyzed. Differences between fluorescence intensity at the colony center versus edges are significant (p < 0.0001) for all experiments except for the first experiment with sfGFP. Errors bars are set at 1% confidence. Signals obtained with the nonfluorescent WT strain were subtracted from the fluorescence signals of strain EM709. Raw values are available (S3 Data). BPS, biosurfactant polysaccharide; Expt., experiment; EPS, exopolysaccharide; OD600, optical density at 600 nm; sfGFP, superfolder green fluorescent protein; WT, wild type.

