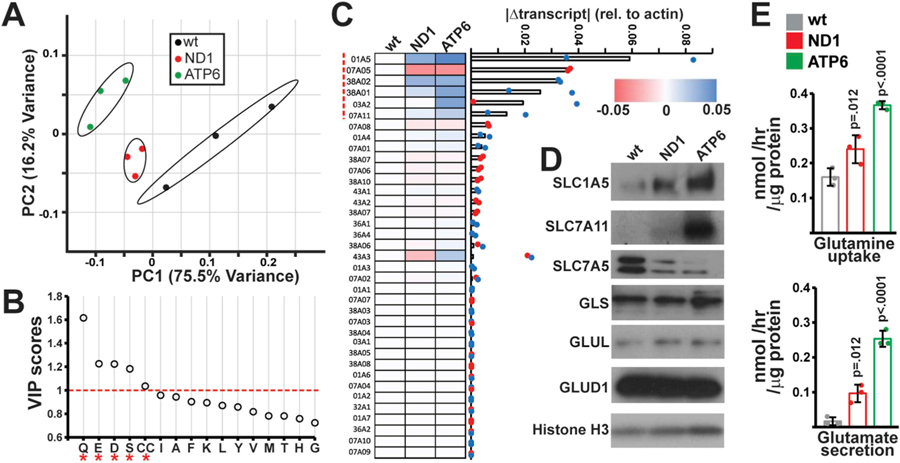
Fig. 2. Alterations amino acid transport in mtDNA mutant cells.
(A) Principal Component Analysis of amino acid levels in fresh and spent media from the indicated cell types. Samples are plotted based on the first two principal components (PC1, PC2) with the indicated contributions to total variance. n = 3 independent samples per group. (B) Variable importance in projection (VIP) scores identified by PLS-DA for amino acids levels in wt, ND1 and ATP6 spent media (n = 3 independent samples per group). VIP scores > 1.0 are indicated by an asterisk (*). (C) qRT-PCR screen of amino acid transporters: Absolute changes from wild-type cells in transcript levels of the indicated transporter are indicated in a heatmap where colors indicate the magnitude and direction of the change in transcript amount (normalized to actin levels). Genes are ordered based on the average absolute magnitude of change in mutant cells. (D) Western blots of indicated transporters and metabolic enzymes in the relevant cell lines. (E) Measurements of glutamine uptake and glutamate secretion in the indicated cell type. Error bars indicate standard deviations from mean of n = 3 independent samples per group. Adjusted p-values calculated by 1-way ANOVA, followed by Tukey’s test for multiple comparisons. (For interpretation of the references to color in this figure legend, the reader is referred to the Web version of this article.)

