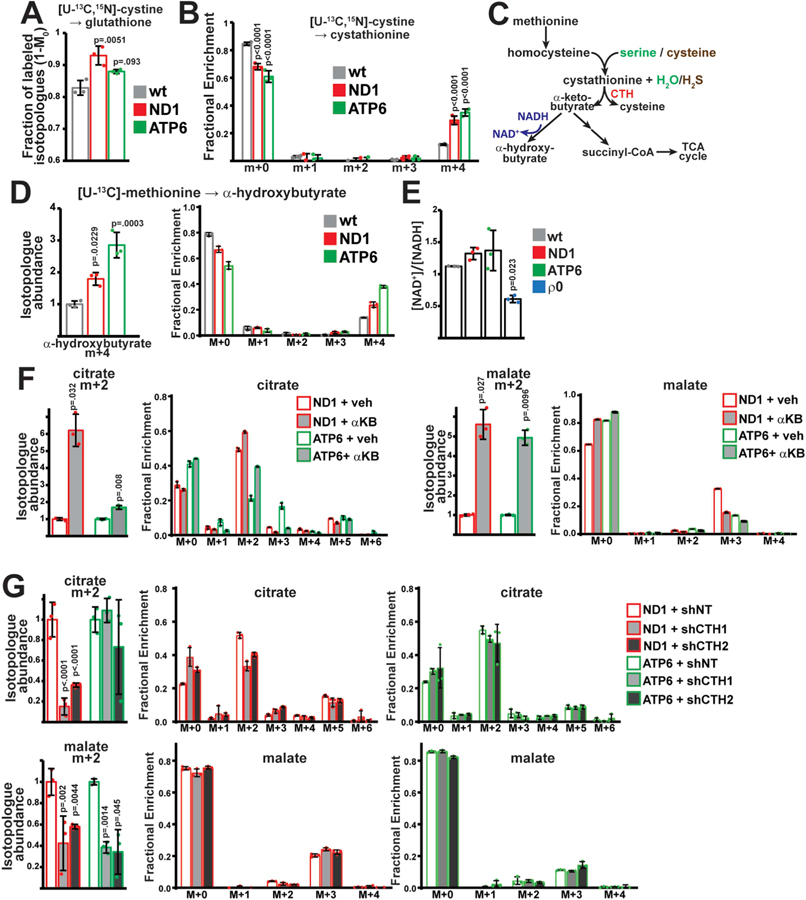
Fig. 4. α-ketobutyrate production from transsulfuration promotes glucose oxidation.
(A) Fractional contribution (1-M0) of cystine to glutathione (GSH) at steady state in the indicated cell lines. (B) Steady-state mass isotopomer distributions of cystathionine after labeling with [U–13C,15N] cystine in the indicated cell lines. (C) Schematic of transsulfuration pathway and potential fates of α-ketobutyrate. CTH, cystathionine γ-lyase. (D) Isotopologue abundance of M+4 α-hydroxybutyrate in spent media from the indicated cell type after labeling with [U–13C] methionine. (E) NAD+/NADH ratios in the indicated cell lines. ρ0, mtDNA-depleted 143B cells. (F) Isotopologue abundance of the indicated metabolites in ND1 and ATP6 cells incubated with vehicle or 1 mM α-ketobutyrate. Cells were subjected to a 1 h pulse with [U–13C] glucose; abundance was normalized to total ion count. (G) Same as F, but with cells expressing non-targeting (shNT) or CTH-targeted (shCTH1, shCTH2) shRNAs. Representative data from a single experiment is shown, and all experiments were repeated at least in triplicate. All error bars indicate standard deviations from mean for n = 3 independent samples. Adjusted p-values calculated from 1-way ANOVA, followed by Tukey’s or Dunnett’s test for multiple comparisons.

