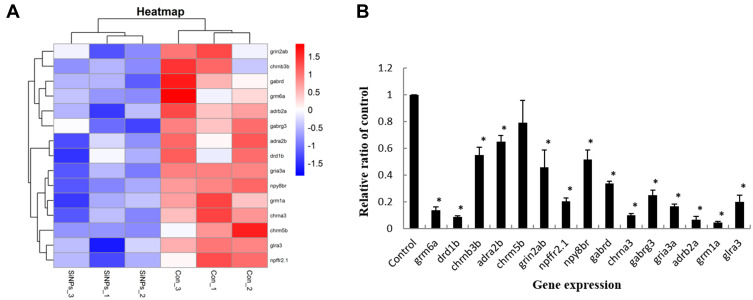
Figure 5.
The effect of SiO2 NPs on the neuroactive ligand–receptor interaction signaling pathway. (A) Heat map from microarray analysis of neuroactive ligand–receptor interaction-related genes. (B) qRT-PCR analysis showed that the genes involved in neuroactive ligand–receptor interaction. Data are expressed as means S.D. from three independent experiments (*p<0.05).

