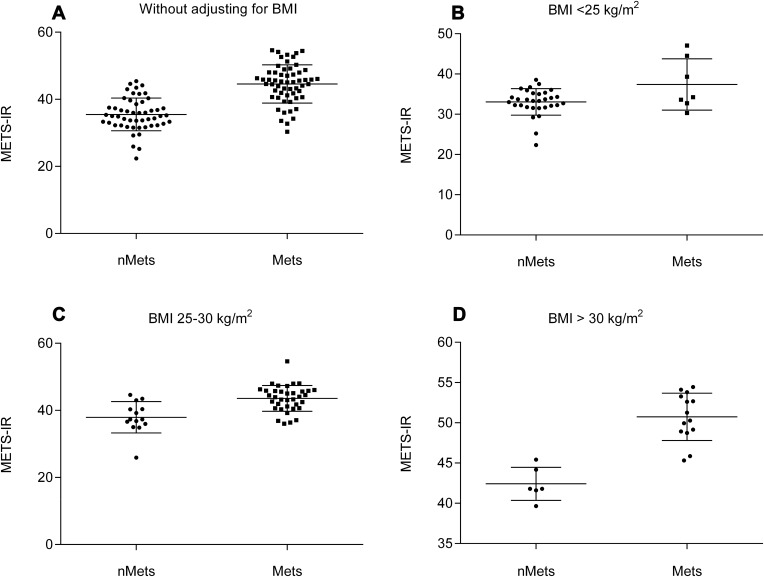
Figure 2.
METS-IR comparative analysis of MetS-OA and nMetS-OA groups. (A) METS-IR comparison between MetS-OA and nMetS-OA groups without adjusting for BMI. (B) METS-IR comparison between MetS-OA and nMetS-OA groups with BMI <25 kg/m2. (C) METS-IR comparison between MetS-OA and nMetS-OA groups with BMI 25–30 kg/m2. (D) METS-IR comparison between MetS-OA and nMetS-OA groups with BMI > 30 kg/m2.

