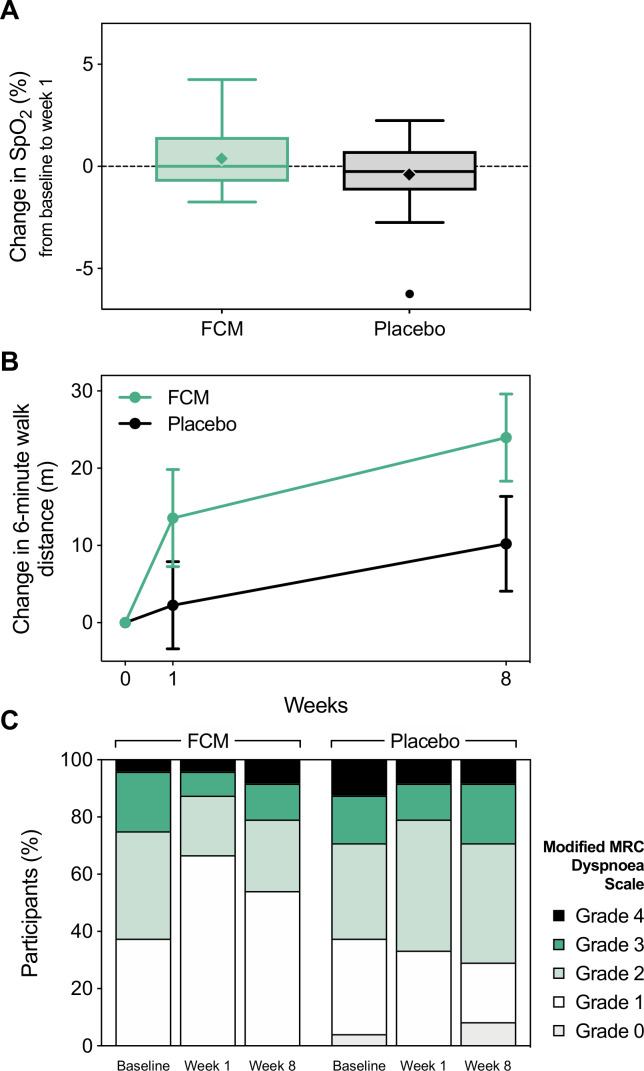
Figure 2.
Primary and main secondary outcomes. (A) Box and whisker plot of the change in peripheral oxygen saturation from baseline to week 1 by treatment allocation (primary outcome). Solid lines indicate the median, boxes represent the IQR, whiskers extend to 1.5 times the IQR, diamonds (◆) represent the mean, and circles (●) represent outliers. (B) Relative changes in 6 min walk distance from baseline visit. Data are shown as mean±SE. Data from two participants in the placebo group were excluded from this graph due to missing 6 min walk tests at one study visit (n=22). (C) Proportions of modified MRC dyspnoea grades at each visit by treatment allocation. FCM, ferric carboxymaltose; MRC, Medical Research Council; SpO2, peripheral oxygen saturation.

