Figure 3.

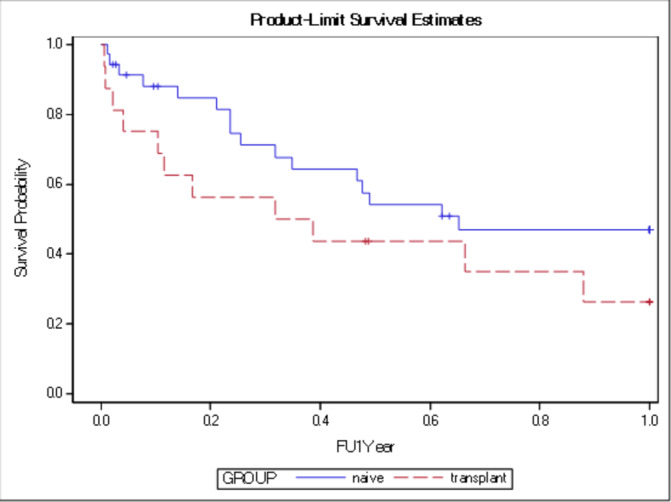
Kaplan-Meier 1-year survival curve for both groups transplanted and non-transplanted (naïve) without significant difference (p=0.26). FU=follow up

Kaplan-Meier 1-year survival curve for both groups transplanted and non-transplanted (naïve) without significant difference (p=0.26). FU=follow up