Figure 8.
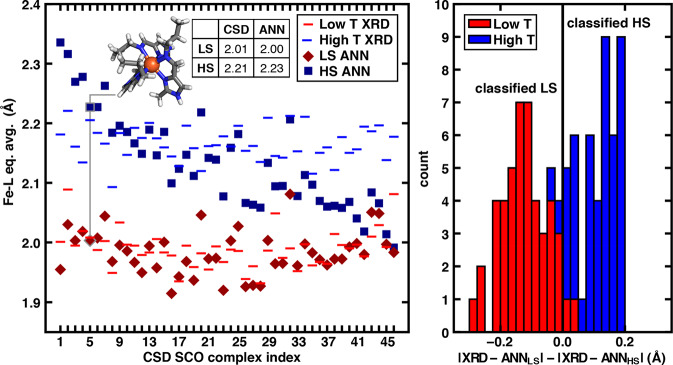
(left) Fe–L equatorially averaged bond lengths (in Å) of identified CSD Fe(II)/N SCO complexes: low- and high-T XRD values (red and blue horizontal lines) are compared to predictions from the ANN for the LS (red diamond) and HS (blue square) states. An example SCO complex is shown as a stick structure in inset (CSD: BAKGUR), corresponding to the points outlined in gray and highlighted by the gray line. Atoms are colored as gray for carbon, blue for nitrogen, white for hydrogen, and brown for iron. The CSD values for the equatorially averaged bond lengths are compared to the ANN-predicted values as shown in the inset table. (right) Overlapping histograms of deviations of ANN-predicted bond lengths from XRD values (in Å) for low-T (red) and high-T (blue) XRD structures. Structures to the left of the vertical line are classified as LS, while structures to the right are classified as HS.

