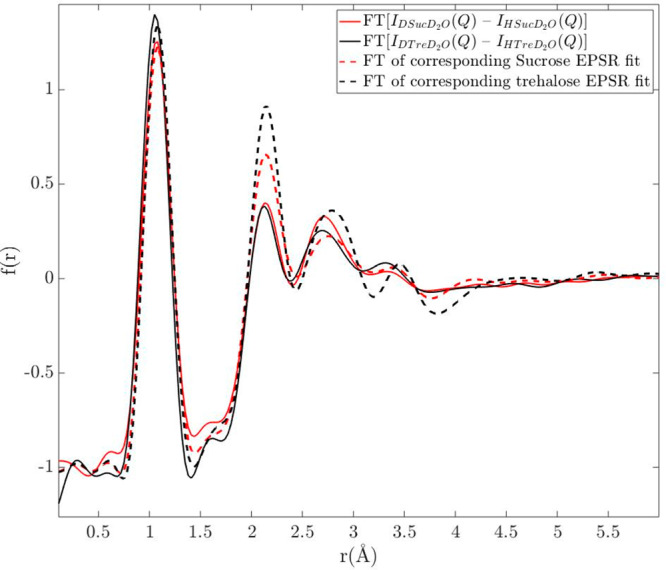
Figure 6.

Correlation functions obtained from the Fourier transform of the difference between the differential scattering cross sections from D-Sug in D2O and H-Sug in D2O (red solid line for sucrose and black solid line for trehalose). Red and black dashed lines represent the Fourier transform of the corresponding EPSR fits for sucrose and trehalose, respectively. The first peak in f(r) at about 1.1 Å is entirely due to intramolecular C–M correlations and consequently not related to the hydration of the disaccharides.
