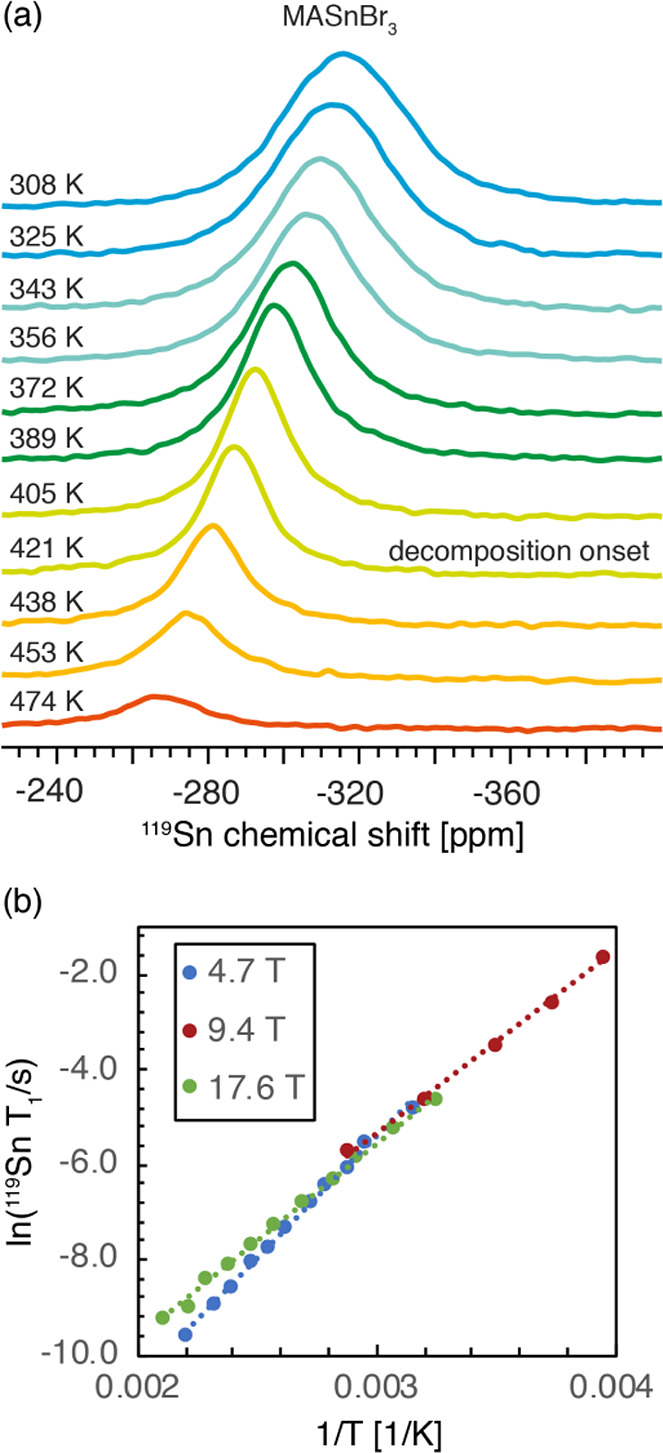
Figure 7.

Halide dynamics in MASnBr3 from multi-field variable-temperature 119Sn solid-state MAS NMR. (a) variable–temperature (308–474 K) 119Sn spectra at 17.6 T. All spectra were acquired using the same number of scans (4096) and are quantitative. The spectrum after thermal decomposition corresponds to MA2SnBr6 (Figure 4b) with traces of SnO2 as discussed above. (b) Arrhenius plot of the 119Sn T1 relaxation data at 4.7 T (blue), 9.4 T (red), and 17.6 T (green). The linear fits are indicated by dotted lines, and the numerical values are given in Table S2.
