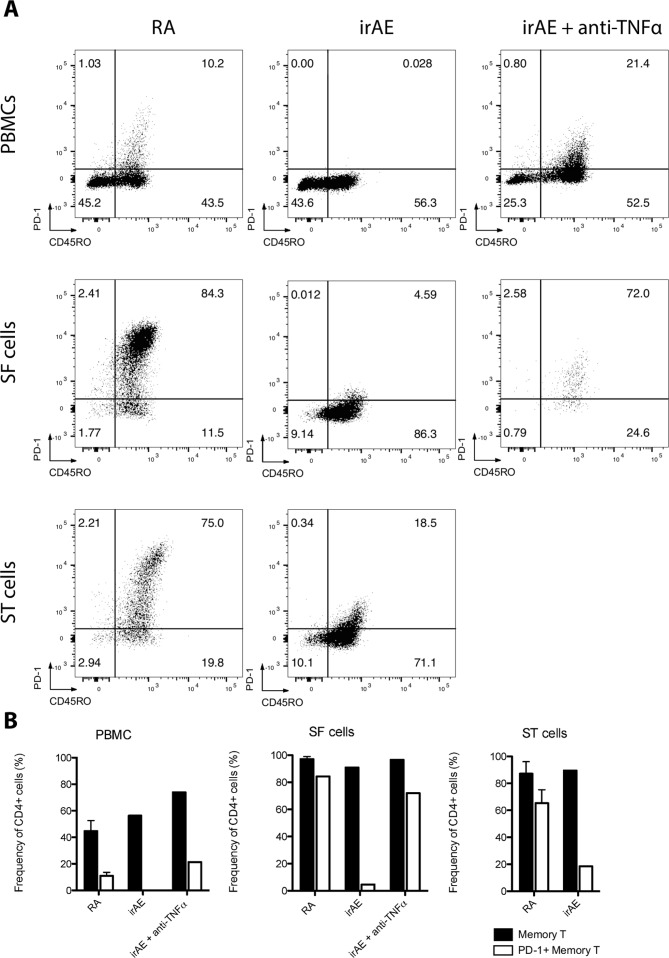
Figure 3.
Abundant PD-1 +memory T cell infiltration resolved in infliximab treated irAE. (A) Peripheral blood mononuclear cells (PBMCs; top row), synovial fluid mononuclear cells (SF cells; middle row) and synovial tissue mononuclear cells (ST cells; bottom row) were prepared and labeled with Zombie UV live/dead stain, CD3, CD4, CD8, CD20, CD45RO and PD-1. CD4 +T cells were then presented on 2D plots identifying memory (CD45RO+) and PD-1 +memory T cells (PD1 +CD45RO+) in early RA (left column), ICI-irAE (middle column) and, infliximab-treated irAE (right column). Early RA plots are representative of all 3 RA samples. (B) Cumulative data showing the frequency of memory T cells and PD-1 +memory T cells for each sample type. 2D, two-dimensional; ICI, immune checkpoint inhibitorir; AE, immune-related adverse events; PD-1, programmed cell death protein-1; RA, rheumatoid arthritis.

