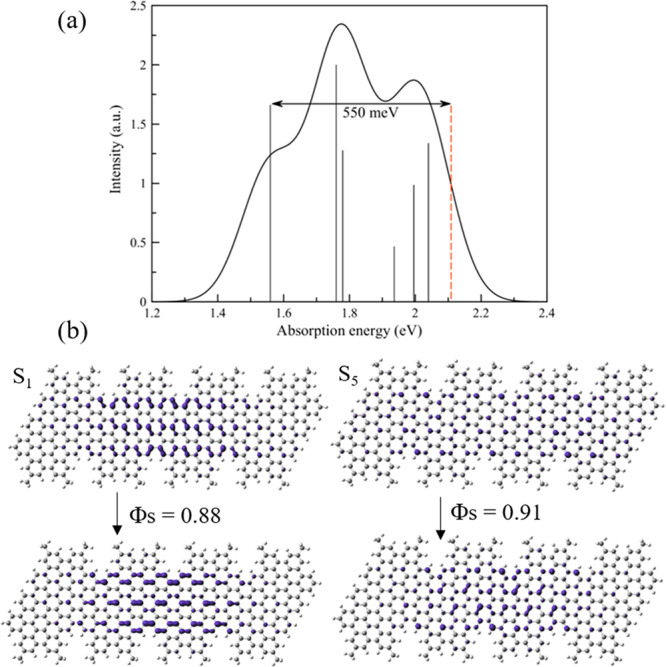
Figure 3.

(a) Computed absorption spectrum for the GNR–AHM tetramer; black vertical bars represent the oscillator strength for the transitions, and the red dashed line represents the band edge. The binding energy is indicated with a black arrow. (b) Detachment/attachment density for the two excited states of interest, S1 and S5, together with their spatial overlap.
