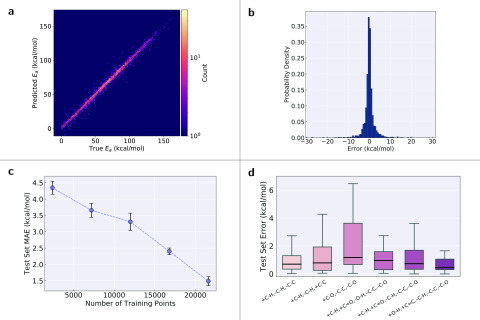
Figure 2.
Deep learning model results. (a) Parity plot of model predictions vs “true” (ωB97X-D3) data for the first fold. (b) Histogram of prediction errors (predicted minus “true”) for the first fold. (c) MAE vs the number of training data points for the deep learning model. The error bars indicate one standard deviation calculated across the ten folds. (d) Distributions of errors (outliers not shown) for the six most frequent reaction types (first fold). Each reaction type includes only the bond changes occurring in the reaction, e.g., +C–H,–C–H,–C–C means that a carbon–hydrogen bond is formed, a different carbon–hydrogen bond is broken, and a carbon–carbon single bond is broken in the reaction.

