
FIGURE 5.
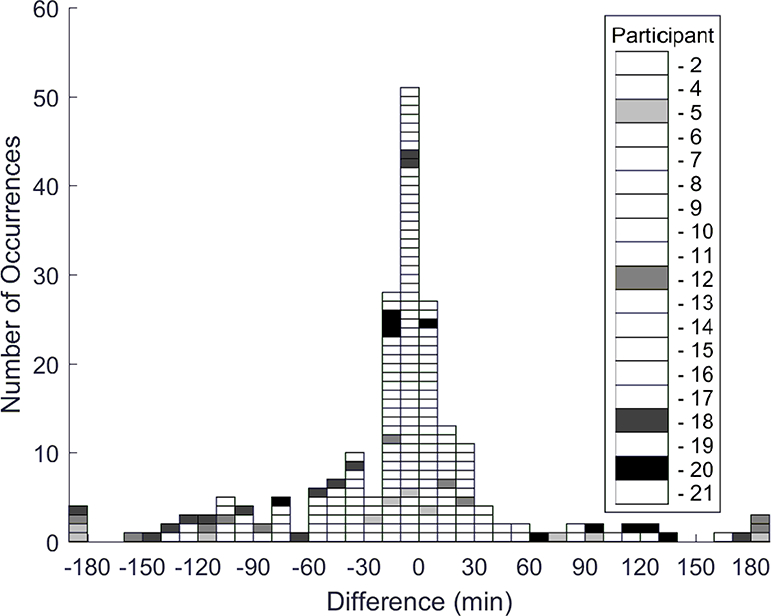
Histogram of day duration differences between WAFER data and participant log records. Four participants (#5, 12, 18, and 20) were responsible for 56% of the differences greater than 60 minutes.
Official websites use .gov
A
.gov website belongs to an official
government organization in the United States.
Secure .gov websites use HTTPS
A lock (
) or https:// means you've safely
connected to the .gov website. Share sensitive
information only on official, secure websites.
Histogram of day duration differences between WAFER data and participant log records. Four participants (#5, 12, 18, and 20) were responsible for 56% of the differences greater than 60 minutes.