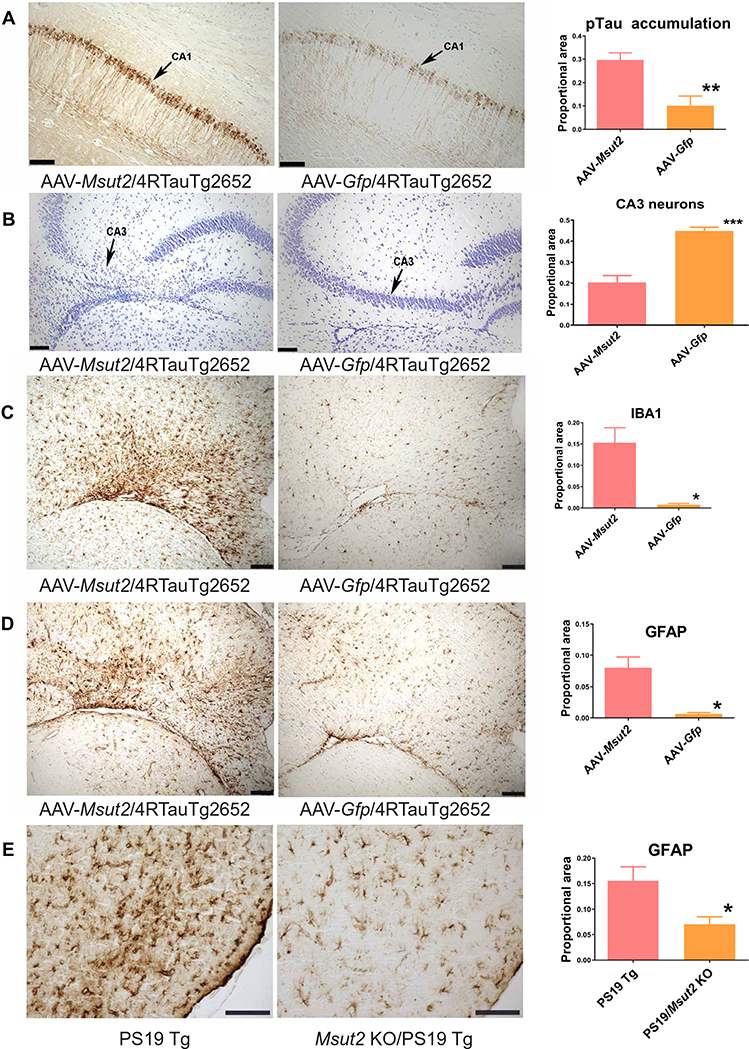
Fig. 4. MSUT2 potentiates neuroinflammation, tau pathology, and neurodegeneration in mouse brain.
(A) Representative brain sections from Tau4RTg2652 mice injected with AAV-Msut2 or AAV-Gfp as control. Brain sections of 4-month-old Tau4RTg2652 mice with tauopathy were stained with the phospho-dependent anti-tau monoclonal antibody AT180 to detect pTau phosphorylated on Thr231 (arrows indicate the CA1 pyramidal cell layer). MSUT2 overexpression exacerbated pTau accumulation in the ipsilateral CA1 region of mouse brain compared to mice receiving an AAV-Gfp injection. Right: Densitometry analysis of AT180-positive pathological tau deposits in Tau4RTg2652 mice overexpressing Msut2 (n = 15) compared to GFP (n = 5) (P = 0.0044 by two-tailed t test). Scale bars, 100 μm.
(B) Representative brain sections of the ipsilateral CA3 region of Tau4RTg2652 mice injected with AAV-Msut2 or AAV-Gfp as control. MSUT2 overexpression exacerbated neuronal loss in the CA3 region compared to GFP overexpression. Neuronal cell bodies were detected by cresyl violet staining (purple; arrows indicate CA3 pyramidal cell layer). Right: Densitometry analysis of pyramidal layer staining in Tau4RTg2652 mice overexpressing MSUT2 (n = 15) compared to GFP (n = 5) (P = 0.0001 by two-tailed t test). Scale bars, 100 μm.
(C) Representative brain sections of the ipsilateral CA3 region of Tau4RTg2652 mice injected with AAV-Msut2 or AAV-Gfp. Microgliosis was detected by immunohistochemical staining of glia with the IBA1 monoclonal antibody in CA3 brain sections from 4-month-old Tau4RTg2652 mice. MSUT2 overexpression exacerbated microgliosis compared to GFP overexpression. Right: Densitometry analysis of IBA1 immunoreactivity in Tau4RTg2652 mice injected with AAV-Msut2 (n = 13) compared to AAV-Gfp (n = 5) (P = 0.024 by two-tailed t test). Scale bars, 100 μm.
(D) Representative brain sections of the ipsilateral CA3 region of Tau4RTg2652 mice injected with AAV-Msut2 or AAV-Gfp. Astrocytosis was detected by immunostaining of brain sections from 4-month-old Tau4RTg2652 mice with anti-GFAP monoclonal antibody. MSUT2 overexpression exacerbated astrocyte reactivity compared to GFP overexpression. Right: Densitometry analysis of GFAP immunoreactivity in Tau4RTg2652 mice overexpressing MSUT2 (n = 14) compared to GFP (n = 5) (P = 0.022 by two-tailed t test). Scale bars, 100 μm.
(E) Representative brain sections of the entorhinal cortex of PS19 transgenic (Tg) mice analyzed for astrocytosis by immunohistochemical staining with anti-GFAP monoclonal antibody. Right: Densitometry analysis of GFAP reactivity in the entorhinal cortex of Msut2 KO/PS19 Tg mice (n = 23) compared to PS19 Tg mice (n = 23) (P = 0.0104 by two-tailed t test). Scale bars, 100 μm. Photomicrographs in (A) to (E) were modified by adjusting brightness and contrast to optimize visualization of staining.

