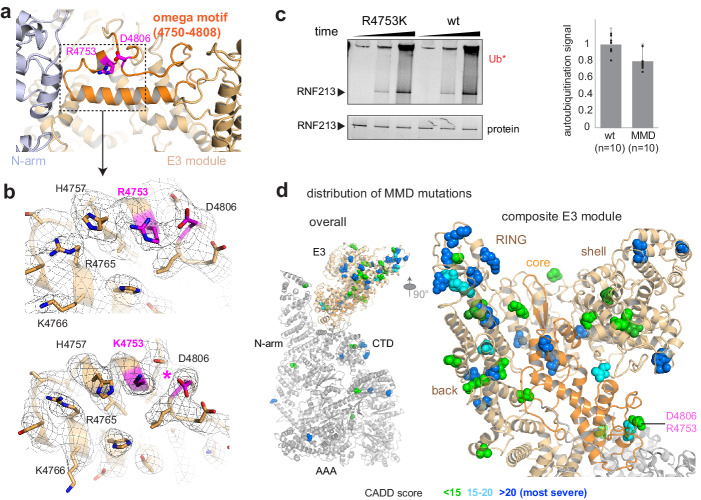
Figure 4. Structural analysis of MMD mutations.
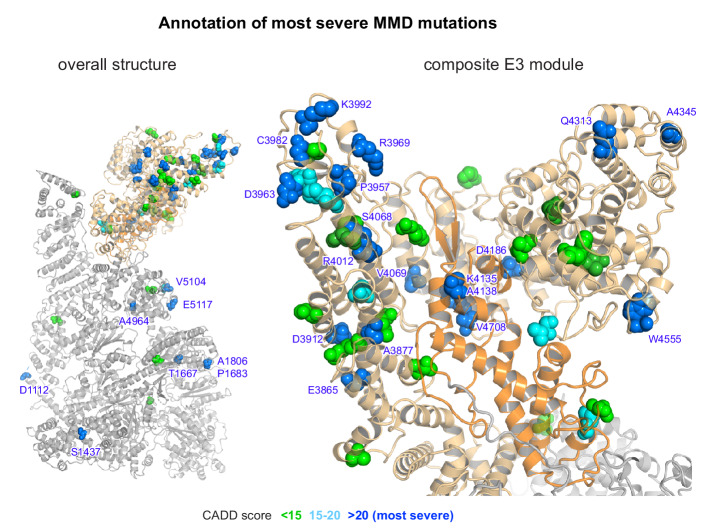
(a) Arg4753 stabilizes the ‘omega’ motif (orange), located in the periphery of the E3 domain. Arg4753 and its partner residue Asp4806 are highlighted. (b) Focused cryo-EM maps of wt (top) and R4753K (bottom), showing that the introduced mutation disrupts the Arg4753-Asp4806 salt bridge (pink), leading to local structural changes. Affected side chains are labelled. (c) Auto-ubiquitination assay with UbcH7 comparing the wt and the R4753K mutant. The bar plot represents the quantification of the poly-ubiquitination signal (Ub*), resulting from ten replicated measurements. Error bars indicate standard deviation. (d) MMD-associated mutations (colored spheres) mapped on the cryo-EM structure of RNF213 cluster in the E3 domain, though separated in sequence by ~1000 residues. The zoomed-in window (right panel) shows that all four portions of the E3 module (core sub-domain shown in orange) carry MMD mutations. Residues are colored by CADD score (0–15 green, 15–20 cyan, 20+ blue; listed in Supplementary file 2). The most pathologic mutations (blue) are individually labeled in Figure 4—figure supplement 1.


