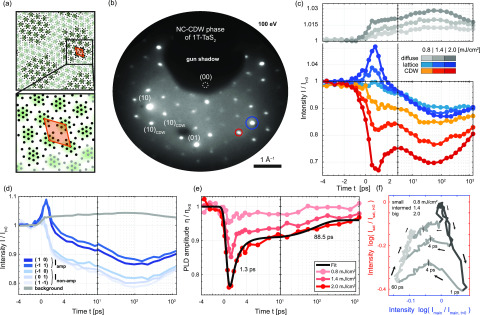
FIG. 8.
Measurements in the NC phase for an electron energy of 100 eV. (a) Top view of the nearly commensurate (NC) CDW phase illustrating the charge density (green), distorted lattice (black dots, displacements exaggerated), and superstructure unit cell (orange). (b) Diffraction pattern of the NC phase of 1T- showing main lattice reflexes and several orders of PLD induced satellites (integration time: 90 s). (c) Time-dependent measurement of reflexes [blue and red circles in (b)] and diffuse background (for three fluences). The main lattice signal is averaged over the (10) and (−1 1) spots (blue), the satellite signal over several reflexes. Curves are normalized to the signal at negative times. (d) Time-dependent intensity of visible main lattice reflexes and integrated background intensity, for a fluence of mJ/cm2. Two inequivalent classes of spot groups are found, featuring a strong (dark blue) and a weak (light blue) sensitivity to the amplitude quench. (e) Extracted PLD amplitude quench and relaxation for three fluences, showing a rapid and a slower relaxation component [time constants from a biexponential fit (black line) to the highest fluence data: 1.3 ps and 88.5 ps]. (f) Main lattice peak intensities vs satellite peak intensities, leading to cyclic trajectories in a 2D plane with varying sizes. Following a two-stage relaxation, all curves reach a common equilibrium line after approximately 60 ps. The gray color scale highlights certain time intervals (dark gray: 0–1 ps, medium, gray: 1–60 ps, and light gray: 60–1500 ps).

