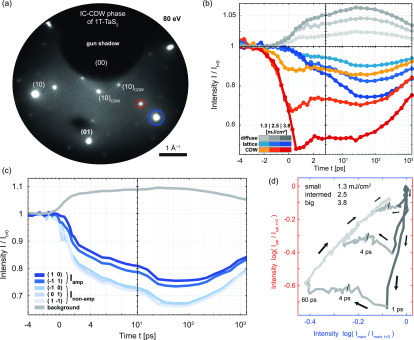
FIG. 9.
Measurements in the IC phase for an electron energy of 80 eV. (a) Diffraction pattern of the IC phase of 1T- showing main lattice reflexes and first-order PLD-induced satellites (integration time: 90 s). (b) Time-dependent measurement of reflexes [blue and red circles in (a)] and diffuse background (for three fluences). The main lattice signal is averaged over the (10) and (−1 1) spots (blue), the satellite signal over several reflexes. Curves are normalized to the signal at negative times. (c) Time-dependent intensity of visible main lattice reflexes and integrated background intensity, for a fluence of F = 3.8 mJ/cm2. Two inequivalent classes of spot groups are found, but none shows a strong dependence on the amplitude quench. (d) Main lattice intensity vs satellite peak intensity, leading to cyclic trajectories in a 2D plane with varying sizes. Note that all curves reach a common equilibrium line after approximately 60 ps. The gray color scale highlights certain time intervals (dark gray: 0–1 ps, medium, gray: 1–60 ps, and light gray: 60–1500 ps).

