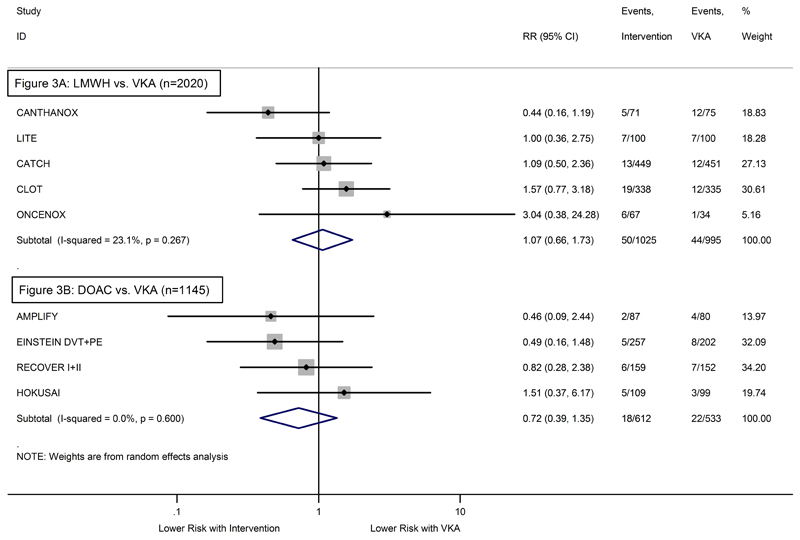
Figure 3. Forest plot of the relative risks (RR) for major bleeding – Pairwise random-effects meta-analysis.
(3A) RCTs comparing LMWH with VKA. (3B) RCTs comparing DOAC with VKA. Grey boxes surrounding relative risk estimates are proportional to the weight of the respective study. P-value of I2 is from Q test.

