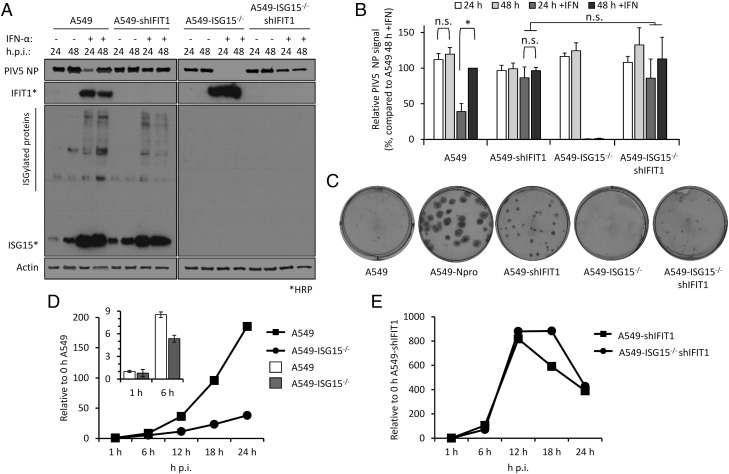
FIGURE 4.
Direct antiviral activity of ISGs is responsible for virus resistance because of ISG15 loss of function. (A) IFIT1 was constitutively knocked down in A549 or A549-ISG15−/− (B8) cells following a previously described method (17). A549, A549-ISG15−/− (B8), and the corresponding IFIT1-knockdown cells were treated with IFN-α, infected with PIV5, and processed as in Fig. 3A. Following immunoblotting with specific Abs, PIV5 NP and β-actin were detected using near-infrared (NIR) dye-conjugated secondary Abs to facilitate quantification. IFIT1 and ISG15 proteins were detected using chemiluminescence following incubation with HRP-conjugated secondary Abs. (B) Experiments described in (A) were performed independently three times (infections were performed on three separate occasions), and NP and β-actin levels were quantified using Image Studio software (LI-COR Biosciences). Signals were relative to those generated from IFN-α–treated A549 cells infected for 48 h p.i. (set to 100%). Error bars represent the SD of the mean from the three independent experiments performed on different occasions. *p < 0.05, using two-way ANOVA and Tukey multiple comparisons test. n.s., no statistical significance. (C) Indicated cells were infected for 1 h with 30–40 PFU of PIV5 (CPI−), a strain unable to block the IFN response because of mutation in the viral V protein. Monolayers were fixed 6 d p.i. Plaques were detected using a pool of anti-PIV5 Abs specific for hemagglutinin (HN), NP, P, and matrix protein (M) [see (24)]. Plaque assays were performed on three independent occasions. (D) A549 and A549-ISG15−/− cells were infected with PIV5 W3 (MOI 10) and harvested at the indicated times. Total RNA was isolated and subjected to cDNA synthesis using oligo(dT) primers. Expression of PIV5 NP was measured using quantitative PCR (qPCR). Relative expression (compared with 1-h A549) was determined following SYBR Green qPCR using ΔΔCt method. β-Actin expression was used to normalize between samples. Error bars represent the SD of the mean from three independent RNA samples. For clarity, the inset bar graph represents viral transcription data at 1 and 6 h p.i. only. (E) Analyses followed that of (D), but A549-shIFIT1 and A549-ISG15−/−/shIFIT1 cells were infected.

