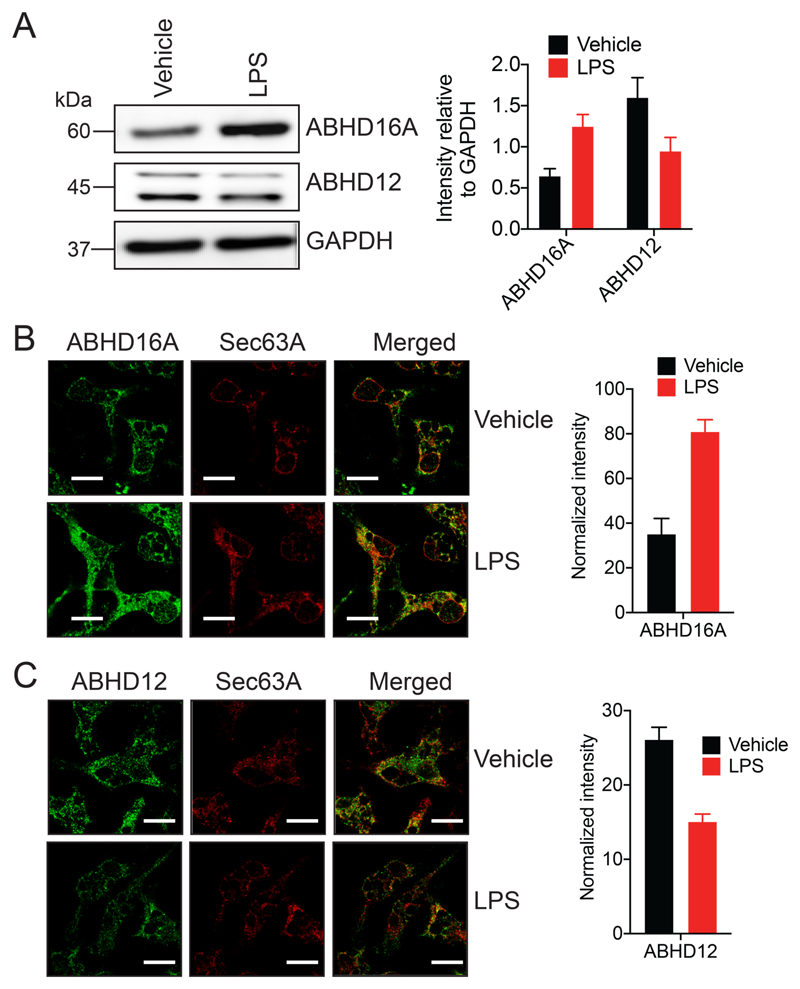
Figure 4. ABHD16A and ABHD12 are ER localized in primary peritoneal macrophages (PPM) after an inflammatory stimulus.
(A) Representative blot and quantitation from western blot analysis of PPM, showing an increase and decrease in ABHD16A and ABHD12 levels respectively following LPS treatment. This experiment was done three times with reproducible result each time. (B, C) Representative images and quantitation from cellular immunofluorescence analysis of PPM, showing an increase and decrease in (B) ABHD16A and (C) ABHD12 levels respectively following LPS treatment. This experiment was done four times with reproducible result each time. Data represents mean ± standard deviation for three or four biological replicates per group. Bars on images in (B) and (C) are 5-μm.

