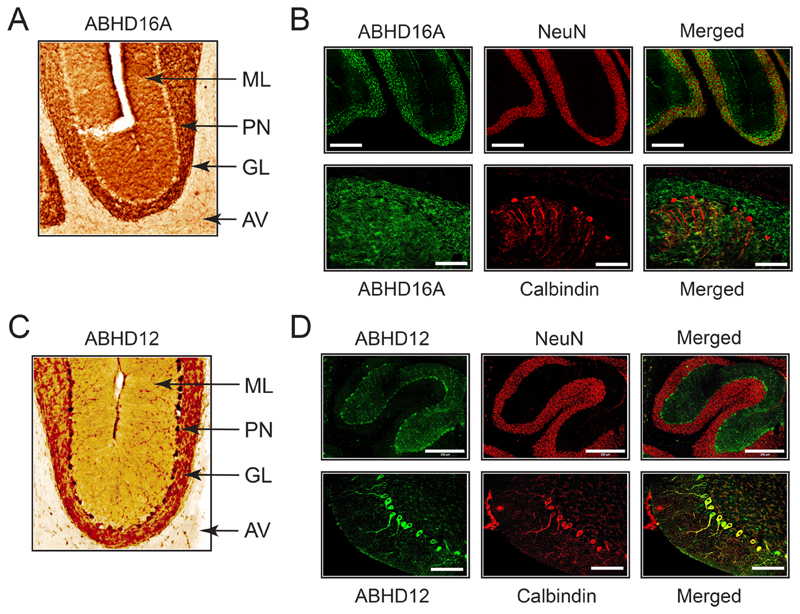
Figure 8. Mapping the anatomical localization of ABHD16A and ABHD12 in wild type mouse cerebellum.
(A) Representative image from DAB based IHC analysis for ABHD16A in a sagittal cerebellar section. (B) Representative image from fluorescence based IHC analysis of ABHD16A, in conjunction with NeuN and Calbindin. (C) Representative image from DAB based IHC analysis for ABHD12 in a sagittal cerebellar section. (D) Representative image from fluorescence based IHC of ABHD12, in conjunction with NeuN and Calbindin. Note: images represented in (A) and (C) are obtained from the sagittal sections of WT mice represented in Figure 6. For (A) and (C), ML = molecular layer, PN = Purkinje neurons, GL = granular layer, and AV = arbor vitae. For (B) and (D), bars for the NeuN IHC panel are 300 μm, while bars for the Calbindin panel are 100 μm.

