Abstract
Objective:
In this study, we assess the diagnostic performance and generalizability of logistic regression in classifying primary vitreoretinal lymphoma (PVRL) vs. uveitis from intraocular cytokine levels in a single-center retrospective cohort, comparing a logistic regression model and the previously published ISOLD score against the IL-10/IL-6 ratio.
Design:
Retrospective cohort study
Participants:
Patient histories, pathology reports, and intraocular cytokine levels from 2339 patient entries in the NEI Histopathology Core database
Methods:
Patient diagnoses of PVRL vs. uveitis and associated aqueous or vitreous IL-6 and IL-10 levels were retrospectively collected. From this data, cytokine levels were compared between diagnoses with the Mann-Whitney U test. A logistic regression model was trained to classify PVRL vs. uveitis from aqueous and vitreous IL-6 and IL-10 and compared with the ISOLD score and IL-10/IL-6 ratio.
Main Outcome Measures:
Area under the curve (AUC) for each classifier; sensitivity, specificity, positive predictive value (PPV), and negative predictive value (NPV) at the optimal cut-off (maximal Youden index) for each classifier
Results:
77 lymphoma patients (10 aqueous, 67 vitreous) and 84 uveitis patients (19 aqueous, 65 vitreous) between 10/5/1999 and 9/16/2015 were included in the study. IL-6 was higher and IL-10 was lower in uveitis patients compared to lymphoma patients (p <0.01). For vitreous samples, the logistic regression model, ISOLD score, and IL-10/IL-6 ratio achieved AUCs of 98.3%, 97.7%, and 96.3% respectively. Sensitivity, specificity, PPV, and NPV at the optimal cutoffs for each classifier were 94.2%, 96.9%, 97%, 94% for the logistic regression model, 92.7%, 100%, 100%, 92.9% for the ISOLD score, and 94.2%, 95.3%, 95.6%, 93.9% for the IL-10/IL-6 ratio. All models achieved complete separation between uveitis and lymphoma in the aqueous data set.
Conclusion:
The accuracy of the logistic regression model and generalizability of the ISOLD score to an independent patient cohort suggest that intraocular cytokine analysis by logistic regression may be a promising adjunct to cytopathology, the gold standard, for the early diagnosis of primary vitreoretinal lymphoma. Further validation studies are merited.
PRECIS
Logistic regression demonstrated high sensitivity, specificity, and strong generalizability in differentiating primary vitreoretinal lymphoma from uveitis by intraocular IL-6 and IL-10 levels.
INTROSUCTION:
Primary vitreoretinal lymphoma (PVRL) is most commonly an aggressive large B-cell non-Hodgkin’s lymphoma. It is relatively rare, as only around 300–380 new diagnoses are made annually in the United States; however, approximately 80%of cases develop central nervous system involvement with poor prognosis.1–2
Early diagnosis of local ocular disease is thus critical and has been shown to significantly prolong survival.3 However, PVRL presents a significant diagnostic challenge as its low incidence and highly nonspecific clinical presentation – blurred vision, floaters, and vitreous cells – often results in initial misdiagnosis, most commonly as an intermediate or posterior non-infectious uveitis. This is further exacerbated by the observation that patients will often improve transiently with corticosteroids initiated for presumed uveitis.
The definitive diagnosis of PVRL currently requires cytology from an aqueous or vitreous sample; however the detection rate can be low (44.5% in one large study) due to low cellular yields of fragile lymphoma cells. These lymphoma cells require prompt fixation and analysis and are often lost in the background of significant lymphoma-associated cell necrosis and reactive immune cells.4 As a result, the diagnosis of PVRL is often delayed, taking on average 1–2 years from the onset of symptoms and typically requiring multiple biopsies.3,5,6
To address these current limitations in diagnosing PVRL, significant efforts have been made to develop adjunctive diagnostic studies such as flow cytometry; PCR analyses for IgH rearrangements, t(14:18) chromosomal translocations, and MYD88 mutations; next generation sequencing for known oncogenic mutations; and intraocular cytokine analysis.7,8 Of the intraocular cytokines, IL-6 and IL-10 have been the most extensively studied. IL-10 is a B cell growth and differentiation factor implicated in the pathophysiology of B cell lymphomas and found to be elevated in the blood of non-Hodgkin’s lymphoma patients.8,10 IL-6 is a pro-inflammatory cytokine elevated in inflammatory diseases and targeted in the treatment of immunemediated diseases such as rheumatoid arthritis, and more recently, uveitis.11,12 Because intraocular (specifically vitreous) samples may be diluted or undiluted, the IL-10/IL-6 ratio is used to normalize for different degrees of dilution between samples.
Several studies have reported success using IL-10 and IL-10/IL-6 ratio to differentiate lymphoma from uveitis, and both are used in some centers as an adjunctive test in patients for whom clinical suspicion is high for PVRL. However, several studies have also demonstrated that a low IL-10 level, for which there is currently no consensus cut-off, or an IL-10/IL-6 ratio < 1 does not always exclude lymphoma.4,13–17
More recently, Costopoulos et al. developed a logistic regression model, the Interleukin Score for IntraOcular Lymphoma Diagnosis (ISOLD), which estimated the probability of PVRL from IL-6 and IL-10 levels in a large multi-center European cohort with high sensitivity (93%), specificity (95%), and confidence (92% of samples were given either ≥99% probability of having PVRL or ≥99% probability of having uveitis). The ISOLD score is given as −12.871 + 5.533 log([IL-10] + 1) – 1.614 log([IL-6] + 1) for aqueous samples, and −12.208 + 4.648 log(([IL-10] + 1) – 1.669 log([IL-6] + 1) for vitreous samples. From the calculated ISOLD score, the probability of PVRL is then estimated as 1/(1 + exp(–ISOLD))16
In this study, we evaluate the generalizability of the ISOLD score and IL-10/IL-6 ratio to a single-center retrospective American cohort. Furthermore, we train and test a logistic regression model on the American cohort to assess the overall diagnostic performance of logistic regression in differentiating PVRL from uveitis.
MATERIALS & METHODS
Sample Processing
All patients included in the study were enrolled in IRB approved clinical protocols at the National Eye Institute. The study was approved by the National Eye Institute Institutional Review Board for human subjects in adherence to the tenets set forth in the Declaration of Helsinki. Informed consent was obtained from all patients. Specimens from outside the NIH were delivered on ice, while specimens obtained at the NIH Clinical Center were immediately transferred to a CLIA certified NIH laboratory within one hour of collection. Most vitreous samples were diluted; however, all aqueous samples were undiluted. Samples were then centrifuged to isolate cells for cytology and supernatant for diagnostic assays, including ELISA for cytokine levels. Patient laboratory findings and diagnoses were then recorded in a National Eye Institute (NEI) Histopathology Core database.
Data Extraction
Patient histories, pathology reports, and aqueous or vitreous IL-6 and IL-10 levels were retrospectively extracted from the National Eye Institute (NEI) Histopathology Core database using the pandas 0.23.4 library and Python 3.5.6. Undetectable intraocular cytokine levels were set to 0.01 pg/ml to avoid division by zero. Definitive diagnoses of uveitis or lymphoma were made by a certified ophthalmic pathologist (CCC) based on cytology findings with consideration of clinical, cytokine, and molecular data. Data from patients with diagnoses and either IL-6 or IL-10 levels were included in the statistical analysis comparing IL-6 and IL-10 levels between lymphoma and uveitis patients. Data from patients with diagnoses and both IL-6 and IL-10 levels were included for classification by a logistic regression model, the ISOLD score, and the IL-10/IL-6 ratio.
Statistical Analysis
Aqueous and vitreous IL-6 and IL-10 levels between lymphoma and uveitis patients were compared by the nonparametric Mann-Whitney U test due to non-normal distributions and unequal variances between groups. Statistical analyses were performed using GraphPad Prism 7 statistical software (San Diego, CA,USA) and a two-tailed p-value of less than 0.05 was considered statistically significant.
Classification
The ISOLD score and IL-10/IL-6 ratio were calculated for all patients with diagnoses and both IL-6 and IL-10 levels to test generalizability. A logistic regression model with IL-6 and IL-10 as independent variables was also trained and tested using nested cross validation to evaluate the overall performance of logistic regression in differentiating PVRL from uveitis in the dataset using the Python sci-kit learn library. Nested cross-validation (10×10 for vitreous specimens and 5×5 for aqueous specimens due to sample size limitations) was used to select the optimal L2 regularization hyperparameter for reducing overfitting during model training, given the small size of the dataset.18 Receiver operator characteristic (ROC) curves were produced; and area under the ROC curve (AUC), as well as sensitivity, specificity, positive predictive value (PPV), and negative predictive value (NPV) at thresholds determined by the maximal Youden index were calculated to compare overall model performance between the three classifiers.19 Coefficients and confidence intervals for the regularized logistic regression model parameters were generated by 1000 iterations of nonparametric bootstrap per fold of cross-validation. The effects of adding age, gender, interaction, and polynomial terms to the logistic regression model on classification performance were also tested. Data sets and code for this study will be made available on OSF at https://osf.io/3tv2e/ (DOI: 10.17605/OSF.IO/3TV2E) and on Github at https://github.com/sen-lab/Cytokines.
RESULTS
Study Population
Patient screening steps for inclusion in the study and the resulting study demographics are shown in Figure 1. From 2339 patient entries entered into the NEI Histopathology Core database between 10/5/1999 and 9/16/2015, 386 patients reported IL-6 levels and 296 patients reported both IL-6 and IL-10 levels. All patient entries with IL-10 levels also reported IL-6 levels. 219 patients had diagnoses and IL-6 or IL-10 levels, and were included in the statistical analysis comparing IL-6 and IL-10 levels between lymphoma and uveitis patients. 161 patients had diagnoses and both IL-6 and IL-10 levels, of which at least one had a detectable level, and were included for classification by the logistic regression model, the ISOLD score, and the IL-10/IL-6 ratio.
Figure 1.
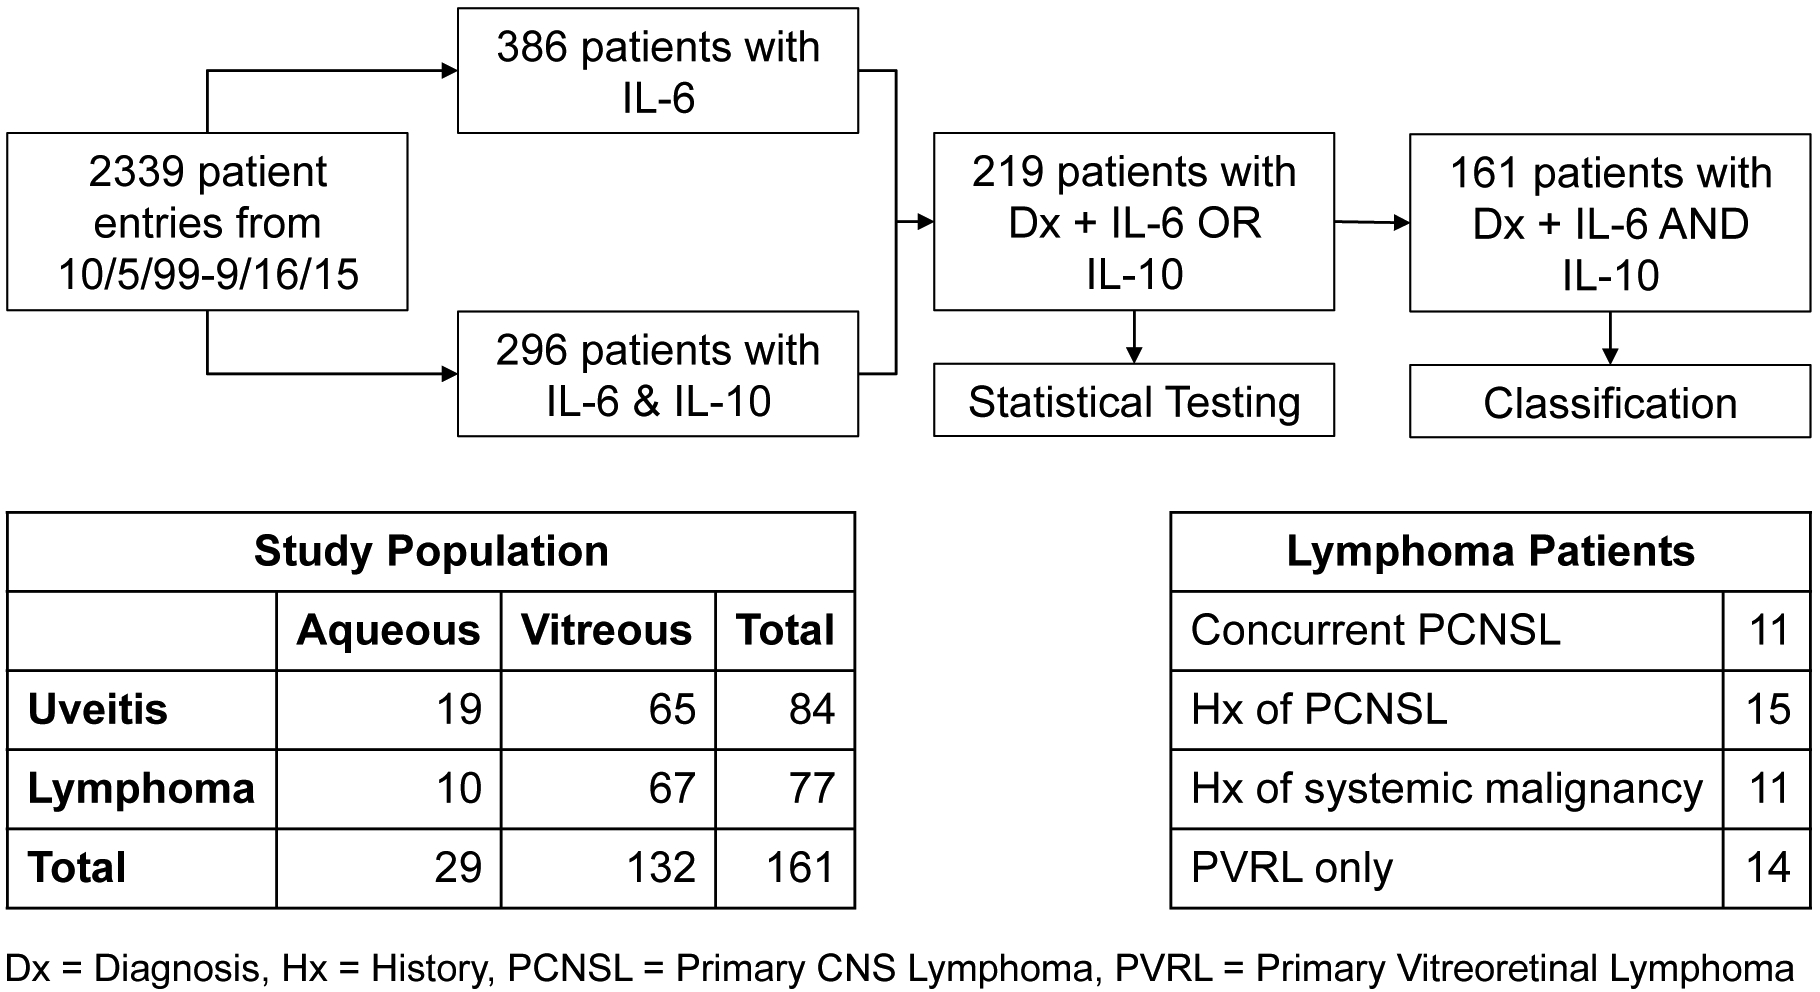
Flow chart of patient screening steps for inclusion in study and resulting study demographics
These 161 patients included 77 B cell lymphoma patients and 84 uveitis patients.132 had vitreous specimens taken and 29 had aqueous specimens taken. Of the 77 lymphoma patients, 11 had concurrent primary CNS lymphoma (PCNSL), 15 had history of PCNSL, 1 had history of small cell lung cancer, and 10 had history of non-CNS lymphomas (Figure 1). Additional patient demographics are displayed in Table 1.
Table 1.
Additional study population demographics
| # patients | Mean age ± SD | Sex (% male) | |
|---|---|---|---|
| Lymphoma | 77 (10 aq, 67 vit) | 65.3 ± 11.9 | 38 (49%) |
| Uveitis | 82 (19 aq, 63 vit) | 64.8 ± 16.1 | 35 (43%) |
Comparing Aqueous and Vitreous IL-6 and IL-10 in Lymphoma vs. Uveitis
The median and range of aqueous and vitreous IL-6 and IL-10 for uveitis and lymphoma patients are shown in Table 2. IL-6 was higher in uveitis patients compared to lymphoma patients in both aqueous (p=0.007) and vitreous (p<0.001) samples. Conversely, IL-10 was significantly higher in lymphoma patients than uveitis patients in both aqueous and vitreous sample (p<0.001 for both) (Figure 2). Of note, in aqueous samples, 4 lymphoma patients had undetectable IL-6 levels and 17 uveitis patients had undetectable IL-10 levels. In vitreous samples, 42 lymphoma patients and 3 uveitis patients had undetectable IL-6 levels, and 3 lymphoma patients and 52 uveitis patients had undetectable IL-10 levels. In total, 121 patients with aqueous or vitreous samples had an undetectable IL-6 or IL-10 level.
Table 2.
Median aqueous and vitreous IL-6 and IL-10 levels with range in uveitis vs. lymphoma
| Uveitis | Lymphoma | ||
|---|---|---|---|
| IL-6 (pg/ml) | Aqueous | 589 (35.6–74738.1) | 58.5 (0–921) |
| Vitreous | 130.5 (0–9956.1) | 0 (0–1805) | |
| IL-10 (pg/ml) | Aqueous | 0 (0–130) | 1044.5 (71.8–3388.7) |
| Vitreous | 0 (0–425) | 301.3 (0–89342) |
Figure 2.
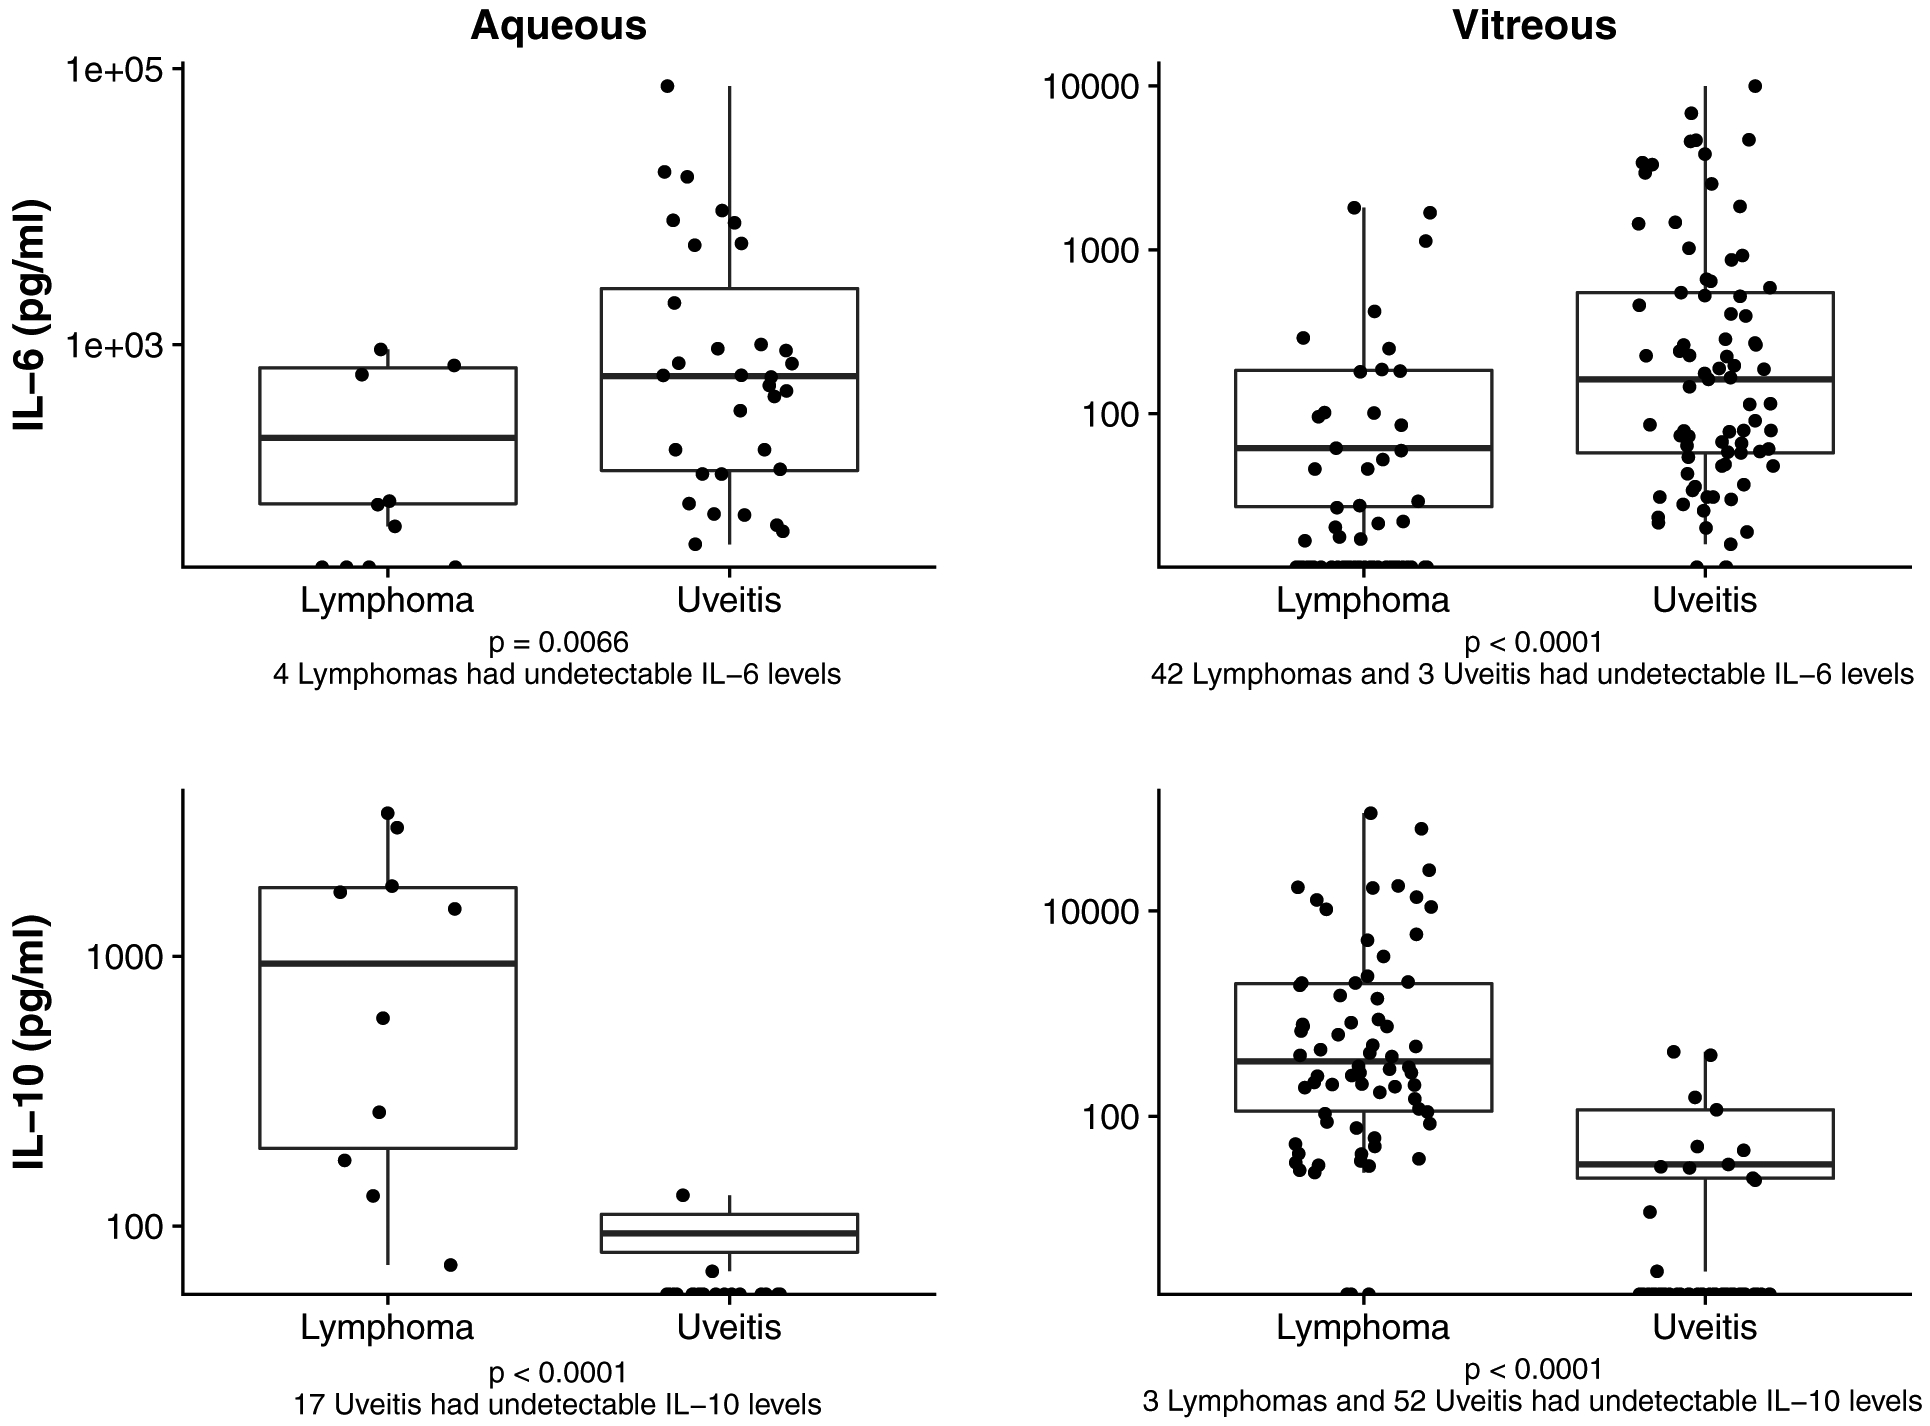
Aqueous and Vitreous IL-6 and IL-10 levels between Uveitis and Lymphoma. Comparisons between uveitis and lymphoma are shown for aqueous IL-6 (upper left), vitreous IL-6 (upper right), aqueous IL-10 (lower left), and vitreous IL-10 cytokine levels (lower right).
Classification by Logistic Regression, ISOLD score, and IL-10/IL-6 ratio
For aqueous samples, the logistic regression model, ISOLD score, and IL-10/IL-6 ratio all achieved complete separation between lymphoma and uveitis, resulting in AUCs, sensitivities, and specificities of 100%. Due to this complete separation between uveitis and lymphoma cases (Figure 3), the coefficients and intercept of the logistic regression model for aqueous data could not be determined.
Figure 3.
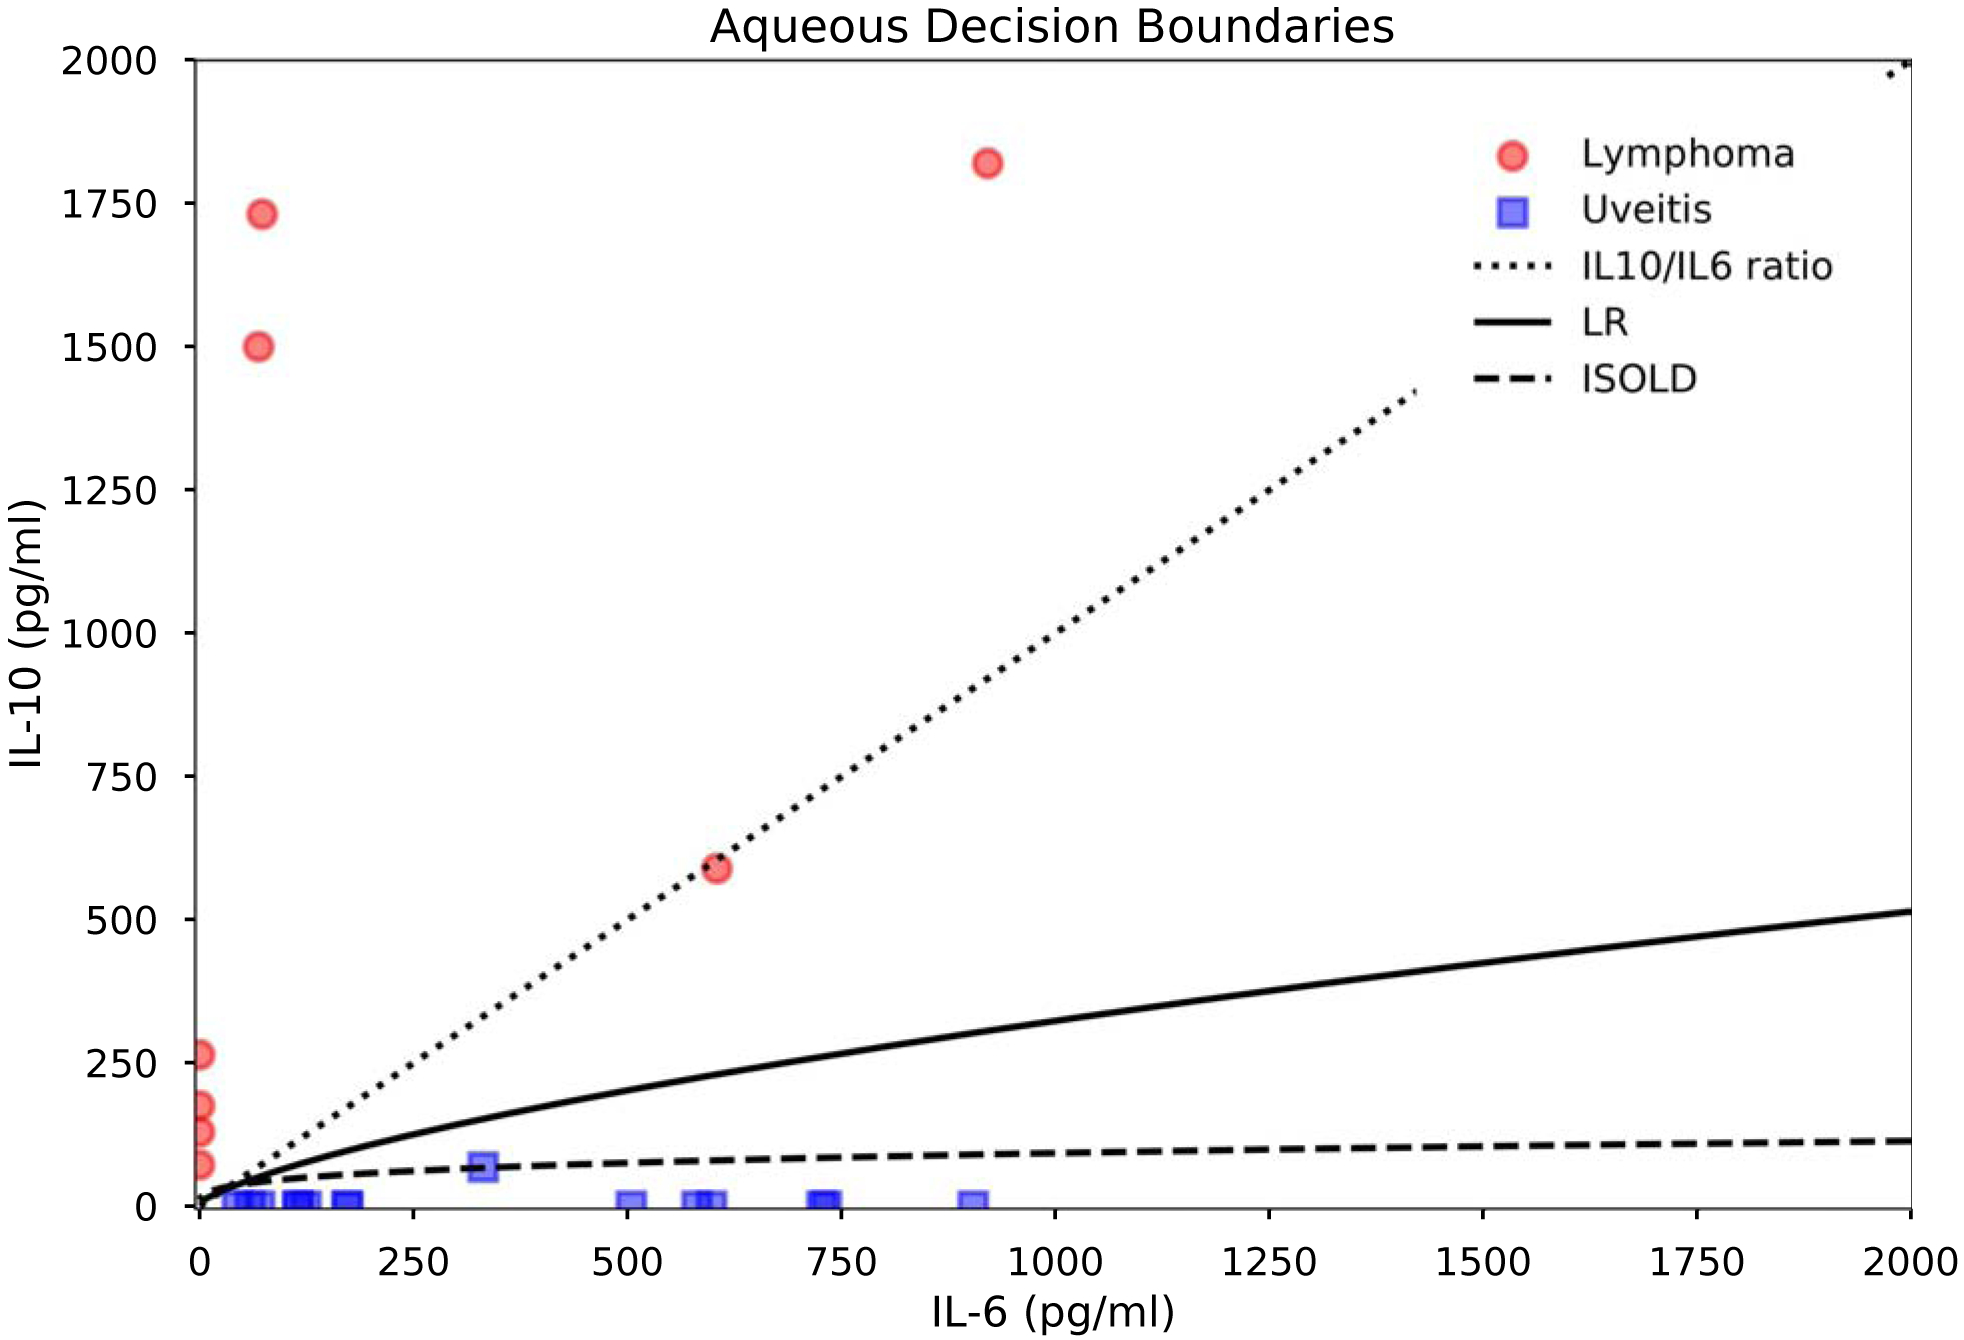
Aqueous classifier decision boundaries and IL-6 and IL-10 levels in PVRL vs. uveitis. Decision boundaries are thresholds corresponding to the maximal Youden index for the logistic regression model and ISOLD score, and IL-10/IL-6 = 1 for the IL-10/IL-6 ratio.
For vitreous samples, classification performance is detailed in Table 3 and Figure 4. Additionally, tables of sensitivity and specificity at each cutoff for the ISOLD score and logistic regression model are provided as Supplementary Materials (Tables S1–S2). Briefly, the logistic regression model, ISOLD score, and IL-10/IL-6 ratio achieved AUCs of 98.3%, 97.7%, and 96.3% respectively. Sensitivity, specificity, positive predictive value (PPV), and negative predictive value (NPV) at the optimal cutoffs for each classifier as determined by the maximal Youden index were 94.2% sensitive, 96.9% specific, 97.0% PPV, 94.0% NPV for the logistic regression model; 92.7% sensitive, 100% specific, 100% PPV, 92.9% NPV for the ISOLD score; and 94.2% sensitive, 95.3% specific, 95.6% PPV, 93.9% NPV for the IL-10/IL-6 ratio. These corresponded to four false negatives (lymphoma classified as uveitis) and two false positives (uveitis classified as lymphoma) classified by the logistic regression model, five false negatives and no false positives classified by the ISOLD score, and four false negatives and three false positives classified by the IL-10/IL-6 ratio. The addition of covariates age and gender to the logistic regression model did not improve classification performance, nor did the addition of interaction or polynomial terms. Coefficients and intercept of the logistic regression model for vitreous data as well as their confidence intervals are listed in Table 4. From these, the probability of PVRL can be estimated as 1/(1 + exp(0.2326log[IL-6]–0.3873 log[IL-10] + 0.6563). Additionally, representative decision boundaries for the three classifiers are shown in Figure 5. Specifically, these decision boundaries are the thresholds corresponding to the maximal Youden index for the logistic regression model and ISOLD score, and IL-10/IL-6 = 1 for the IL-10/IL-6 ratio.All three classifiers misclassified three lymphoma patients who had undetectable IL-10 levels, and one lymphoma patient who had an IL-6 level slightly greater than the IL-10 level. Additionally, one lymphoma patient had an IL-6 level close to the IL-10 level and was misclassified by the ISOLD score. All misclassified lymphoma patients had B-cell lymphomas without CNS involvement at the time of diagnosis. The IL-10/IL-6 ratio misclassified three uveitis patients with IL-10 levels greater than IL-6 of which the logistic regression model also missed two. All three misclassified uveitis patients had idiopathic uveitis: two had panuveitis and one had posterior uveitis.
Table 3.
Vitreous Classification Performance by IL-10/IL-6 ratio, ISOLD, and Logistic Regression.
| IL-10/IL-6 ratio | ISOLD | Logistic Regression | |
|---|---|---|---|
| AUC | 96.3% | 97.7% | 98.3% |
| Sensitivity (95% CI) | 94.2% (85.82–98.40%) | 92.7% (83.89–97.61%) | 94.2% (85.82–98.40%) |
| Specificity (95% CI) | 95.3% (87.10–99.04%) | 100% (94.48–100%) | 96.8 (89.32–99.63%) |
| FN, FP | 4 FN, 3 FP | 5 FN, 0 FP | 4 FN, 2 FP |
| PPV (95% CI) | 95.6% (87.64–99.08%) | 100% (94.40–100%) | 97.0% (89.63–99.64%) |
| NPV (95% CI) | 93.9% (85.20–98.30%) | 92.9% (84.11–97.64%) | 94.0% (85.41–98.35%) |
Figure 4.
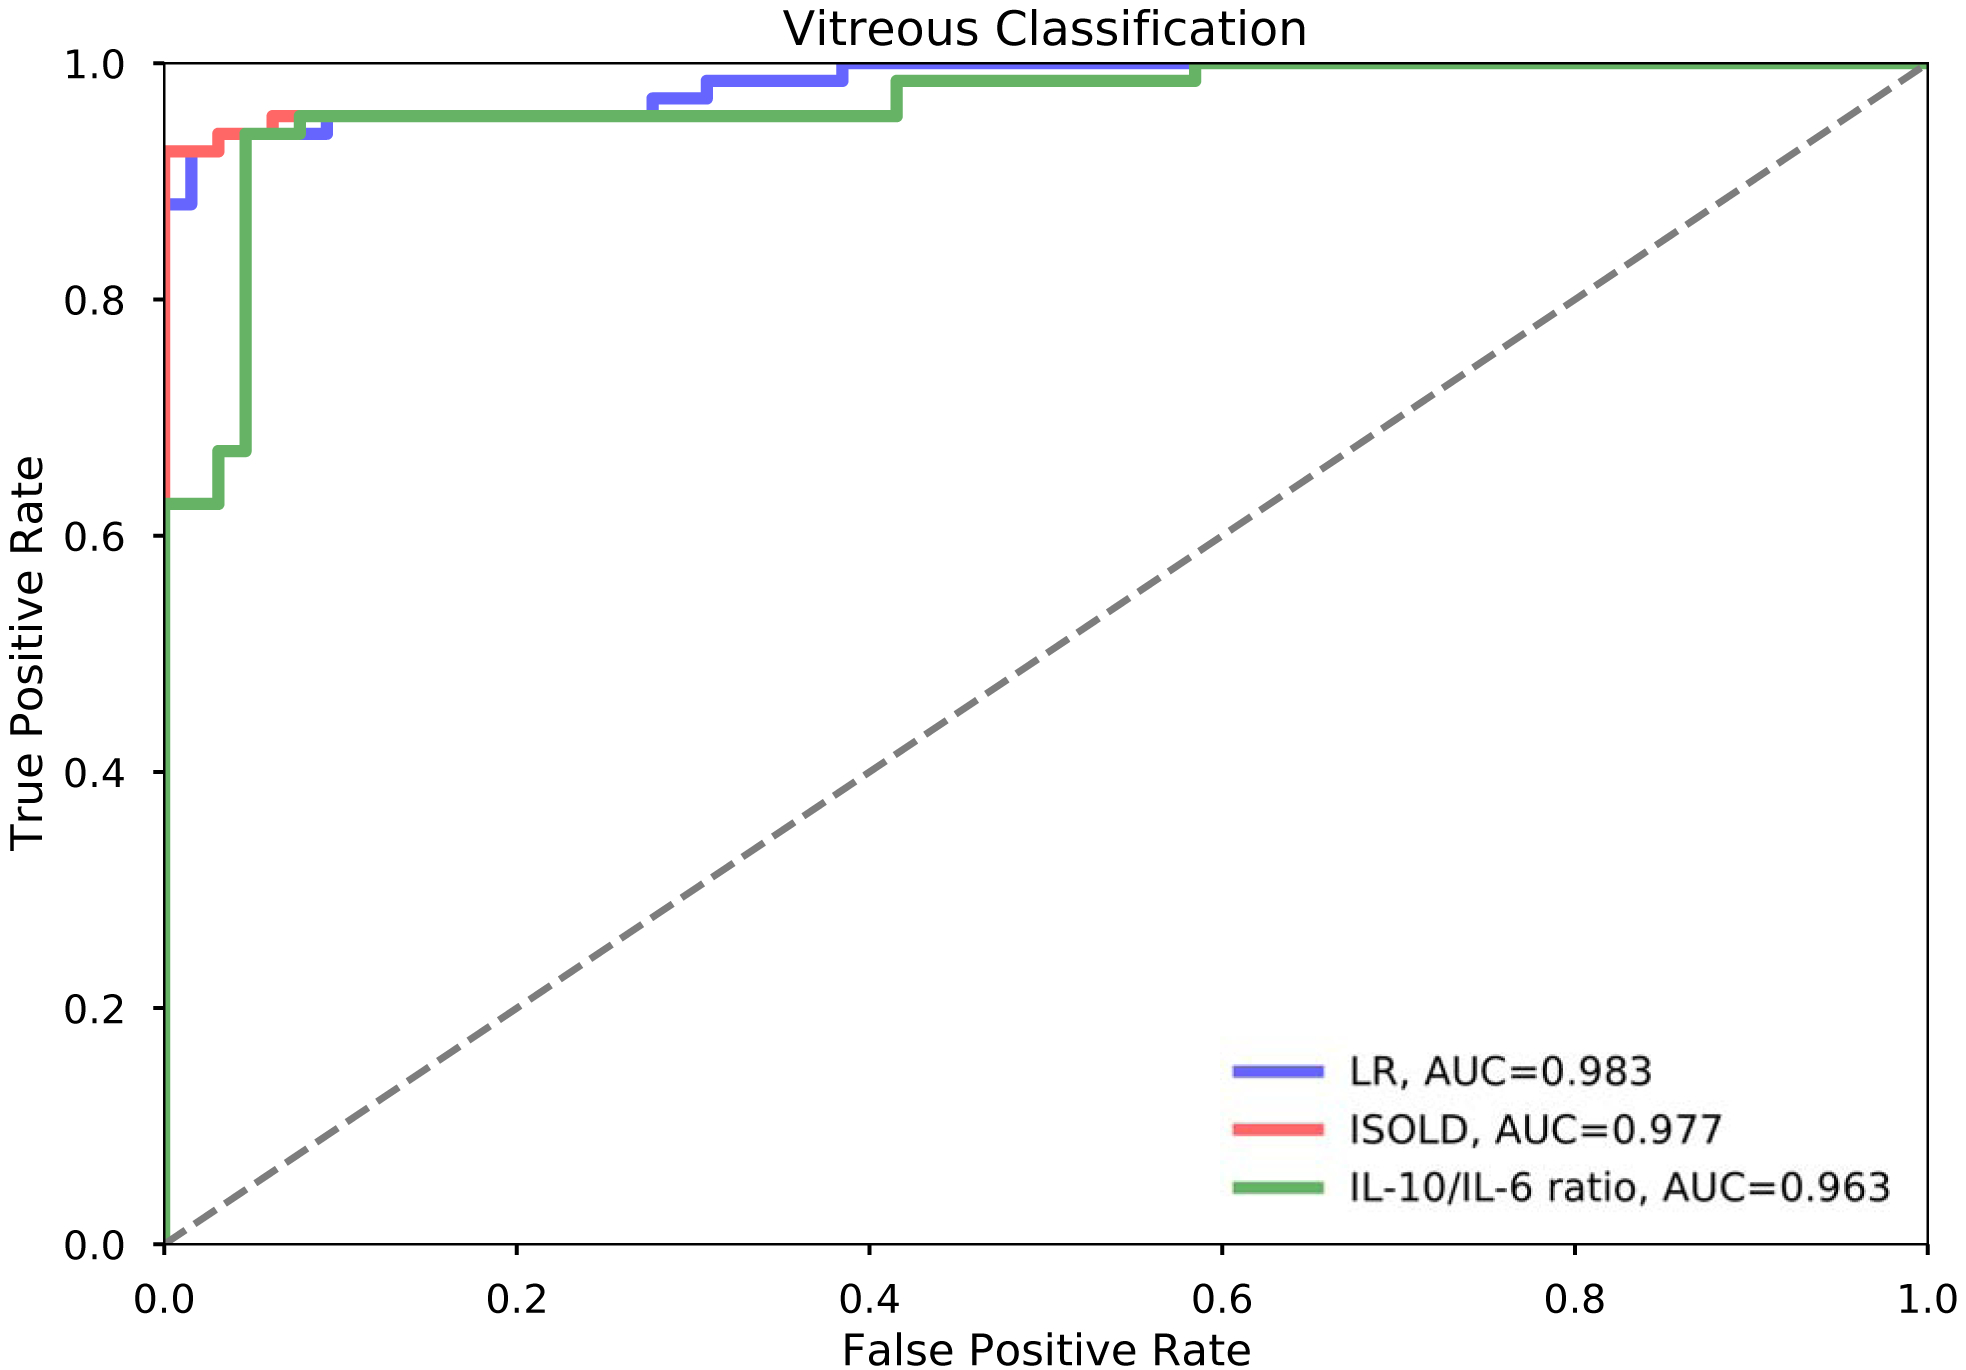
Vitreous Classification Performance by IL-10/IL-6 ratio, ISOLD, and Logistic Regression.
Table 4.
Vitreous Logistic Regression Coefficients, Intercept, 95% CIs.
| Coefficient | 95% CI | |
|---|---|---|
| IL-6 | −0.2326 | (−0.579, −0.047) |
| IL-10 | 0.3873 | (0.076, 1.050) |
| Intercept | −0.6563 | (−2.252, −0.010) |
Figure 5.
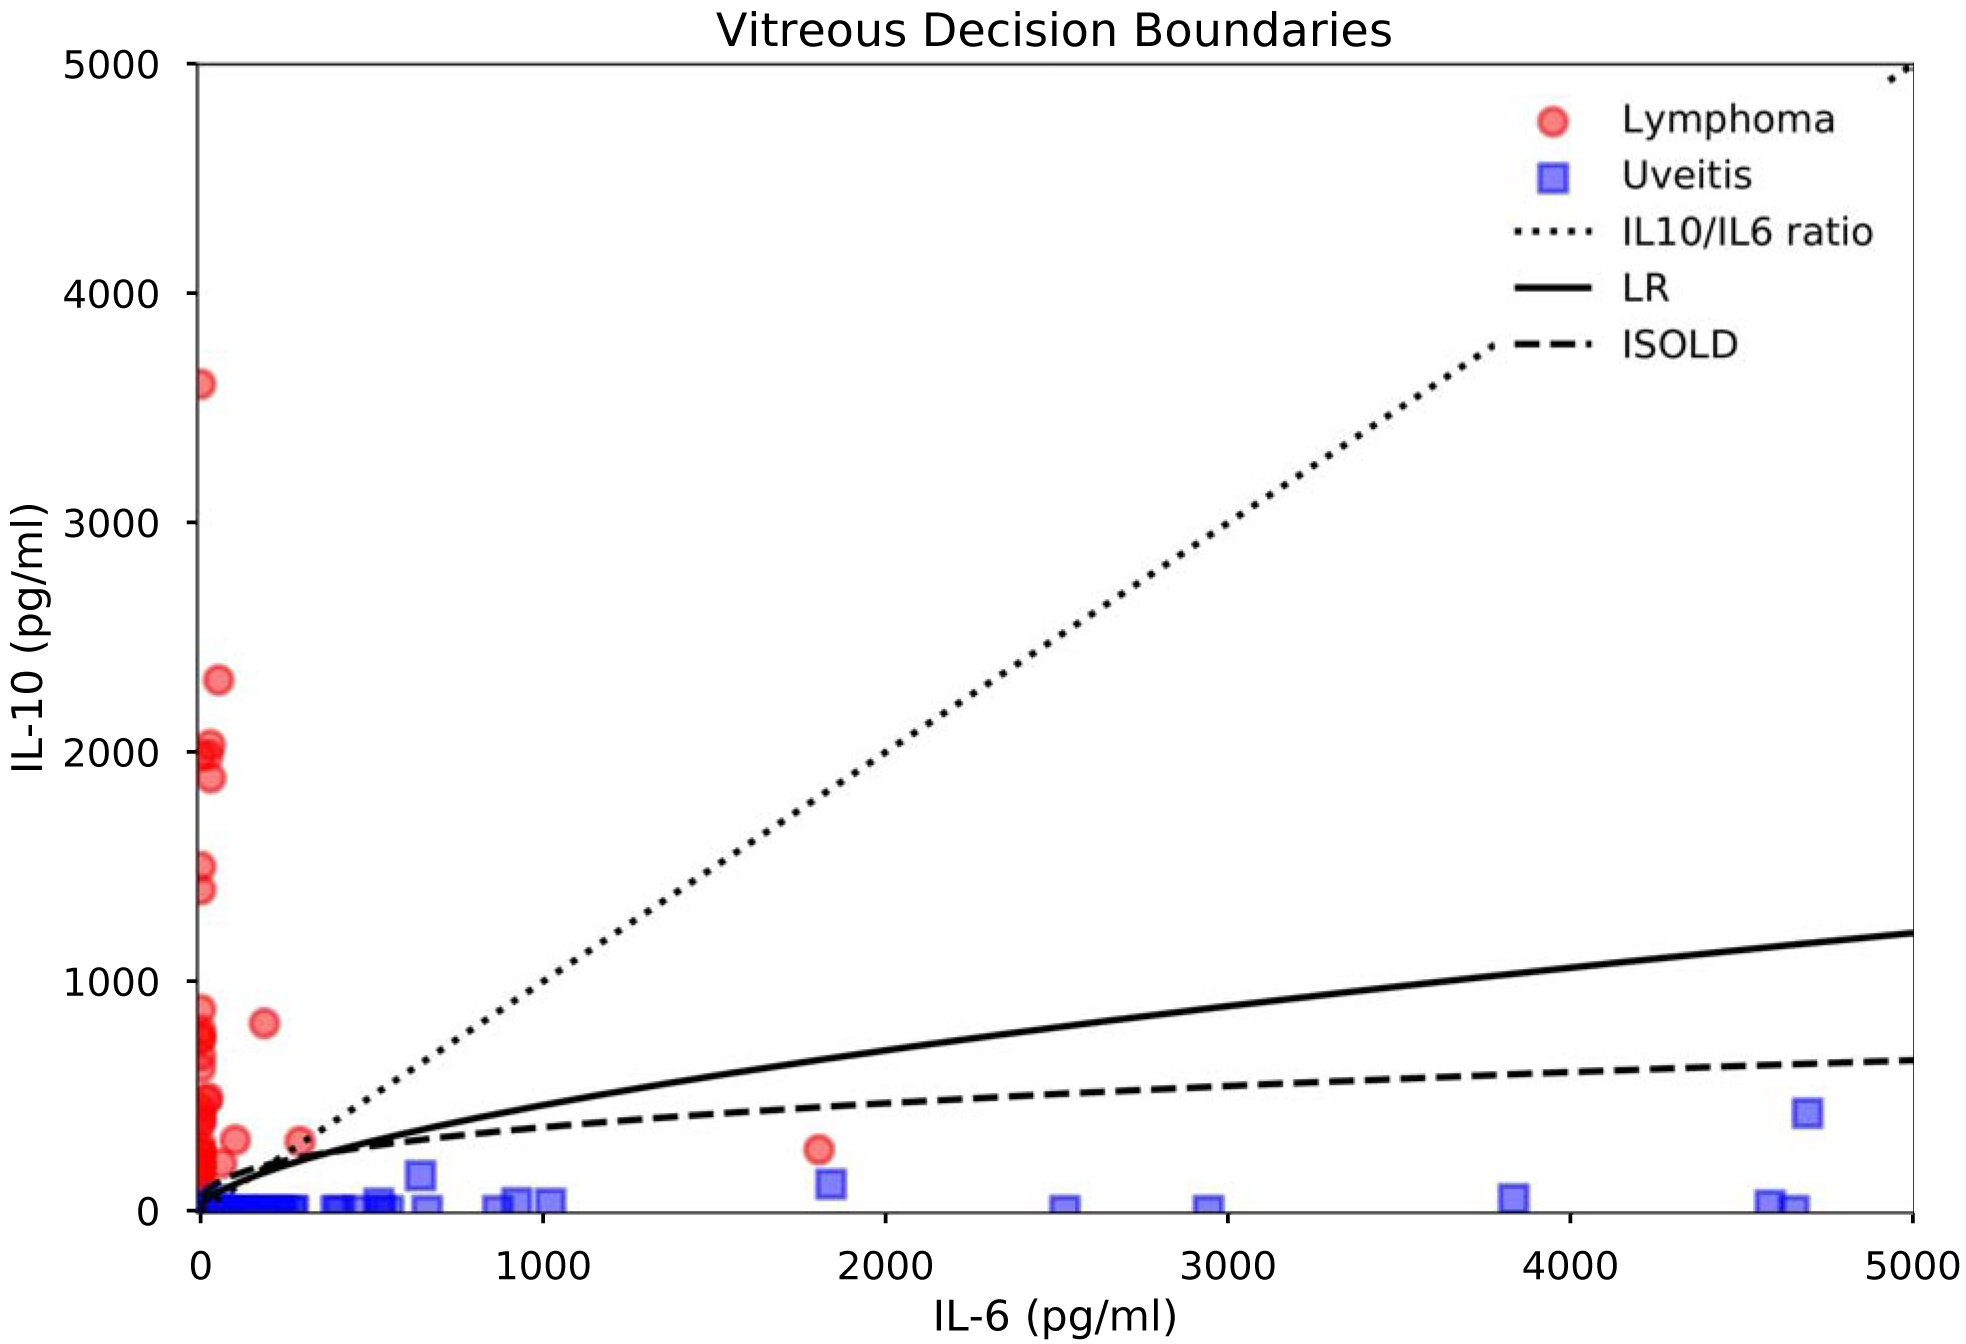
Vitreous classifier decision boundaries and IL-6 and IL-10 levels in PVRL vs. uveitis. Decision boundaries are thresholds corresponding to the maximal Youden index for the logistic regression model and ISOLD score, and IL-10/IL-6 = 1 for the IL-10/IL-6 ratio.
DISCUSSION
Primary vitreoretinal lymphoma remains a difficult and often-delayed diagnosis due to its low incidence, nonspecific presentation, and low detection rate even with invasive biopsy; however, several promising approaches have emerged to improve its early diagnosis. One such approach has been intraocular cytokine analysis using IL-6 and IL-10 levels.
Study of the effectiveness of IL-6 and IL-10 levels and the IL-10/IL-6 ratio in identifying PVRL has yielded mixed results: some studies demonstrate sensitivity and specificity as high as 81–99% and 80–100% respectively, and accuracy as high as 91.7%. Meanwhile, other studies report cases of uveitis with elevated IL-10 and low to undetectable IL-6, and lymphoma with IL-10/IL-6 ratios <1.4,8,15–17
As a result, investigators are exploring more sophisticated methods of intraocular cytokine analysis in efforts to achieve better and more consistent diagnostic performance. Most recently, the ISOLD score, a logistic regression model, demonstrated high sensitivity, specificity, and confidence in identifying PVRL in alarge multi-center European cohort.16
In this study, the ISOLD score generalized very well to an independent American patient cohort, classifying PVRL vs. uveitis from vitreous data with high sensitivity and specificity (Table 3), and correctly classified all patients in the aqueous data set. In its original paper, the ISOLD score demonstrated strong confidence, classifying 92% of samples in its validation cohort with either ≤1% or ≥99% probability of having PVRL, and also noted that no PVRL case in the validation cohort had a ≤1% probability of PVRL, suggesting that any case with ≤1% probability of PVRL can be considered free of PVRL.16
In this independent US cohort, the ISOLD score was similarly confident, correctly classifying 89.4% (144/161) of the cohort with either ≤1% or ≥99% probability of having PVRL, including 77 of 84 uveitis patients and 67 of 77 lymphoma patients. Outside of the three PVRL patients with undetectable IL-10 levels, it did not estimate any PVRL patient as having ≤1% probability of having PVRL. In comparison, the logistic regression model’s estimated probabilities were distributed more uniformly, correctly classifying 53.4% (86/161) of the cohort, 34 of 84 uveitis patients and 52 of 77 lymphoma patients, with either ≤1% or ≥99% probability of having PVRL. Although the ISOLD score was able to maintain a high level of confidence in its probability estimates in this independent American patient cohort, further investigation is needed to validate whether this continues to generalize to other cohorts.
Although both the logistic regression model (98.3%) and the ISOLD score (97.7%) performed better than the IL-10/IL-6 ratio (96.3%) when compared by area under the receiver-operator characteristic curve; clinically, the three classifiers performed very similarly at their optimal cut-offs as determined by the maximum Youden index, being separated by only one or two misclassified patients. Nonetheless, logistic regression provides two additional benefits that merit further consideration. First, in contrast to the IL-10/IL-6 ratio, logistic regression provides a more nuanced and informative estimated probability of primary vitreoretinal lymphoma given a patient’s IL-6 and IL-10 levels. For example, for a vitreous IL-6 of 249.6 pg/ml and IL-10 of 5912 pg/ml, the IL-10/IL-6 ratio outputs 23.68, which is concerning for primary vitreoretinal lymphoma since it is greater than one; however, it is difficult to quantify how concerned we should be given the patient’s cytokine levels. In comparison, the ISOLD score and logistic regression model respectively estimate a 78.9% and 86.4% probability of primary vitreoretinal lymphoma for this patient, which is more useful for correlation with cytology results and clinical findings.
Second, while the IL-10/IL-6 ratio is a fixed measure of the risk of primary vitreoretinal lymphoma, logistic regression is able to improve as it is trained on better data: given a system for consolidating, validating, and curating intraocular cytokine data from centers around the world, one could continually refine a collective predictive model for classifying lymphoma vs. uveitis as new data becomes available. Indeed, such data-driven approaches are already emerging, for example, in lens calculations for cataract surgery.20
A significant limitation of this study is its small sample size, especially with regards to the aqueous data set for which all three classifiers achieved 100% AUC, sensitivity, and specificity, as well as complete separation of data such that the coefficients and intercept for logistic regression could not be determined. More aqueous data is required to develop a reliable logistic regression model and properly validate the ISOLD score. Other limitations of this study include its retrospective nature, and the heterogeneity of sampling during the course of lymphoma, as some patients were sampled at the first presentation of disease, while others were sampled after having received treatment due to concern for relapse of disease. Finally, despite their high sensitivity, specificity, and AUC, the ISOLD score and logistic regression model still incorrectly classified several lymphoma patients as having uveitis, and several uveitis patients as having lymphoma. Used alone, these models would have led to unnecessary testing and treatment of those incorrectly classified as lymphoma and delayed critical life-saving treatment for those incorrectly classified as uveitis. As such, it is imperative to always utilize these models as one of several adjuncts to the clinical history and exam and to the gold standard of cytopathology.
In conclusion, logistic regression achieved high sensitivity and specificity in differentiating primary vitreoretinal lymphoma from uveitis – comparable to if not superior to the IL-10/IL-6 ratio, and demonstrated strong generalizability between independent US and European patient cohorts. Logistic regression furthermore offers a more nuanced and informative estimated probability of lymphoma in comparison to the IL-10/IL-6 ratio, and provides the ability to further improve with better data. These findings suggest that intraocular cytokine analysis by logistic regression may be a promising adjunctive test to cytopathology, the current gold standard for the diagnosis of primary vitreoretinal lymphoma. Further validation in larger and more diverse aqueous and vitreous data sets, especially data sets in which the IL-10/IL-6 ratio fares poorly, is merited, as are efforts to more systematically collect, process, and validate intraocular cytokine data in order to continue to train and refine these predictive models.
Supplementary Material
FINANCIAL SUPPORT:
This research was made possible through the National Eye Institute Intramural Research Program. DEK and MMW were supported by the National Institutes of Health (NIH) Medical Research Scholars Program, a public-private partnership supported jointly by the NIH and generous contributions to the Foundation for the NIH from the Doris Duke Charitable Foundation, American Association for Dental Research, Howard Hughes Medical Institute, and the Colgate-Palmolive Company, as well as alumni of student research programs and other individual supporters. The sponsor or funding organization had no role in the design or conduct of this research. The work of AYL is supported by NIH grant K23EY029246 and a core foundation grant from Research to Prevent Blindness.
Footnotes
Publisher's Disclaimer: This is a PDF file of an unedited manuscript that has been accepted for publication. As a service to our customers we are providing this early version of the manuscript. The manuscript will undergo copyediting, typesetting, and review of the resulting proof before it is published in its final form. Please note that during the production process errors may be discovered which could affect the content, and all legal disclaimers that apply to the journal pertain.
CONFLICT OF INTEREST:
No conflicting relationship exists for any author.
REFERENCES
- 1.Chan CC, Rubenstein JL, Coupland SE, et al. Primary vitreoretinal lymphoma: a report from an International Primary Central Nervous System Lymphoma Collaborative Group symposium. Oncologist 2011;16(11):1589–1599 [DOI] [PMC free article] [PubMed] [Google Scholar]
- 2.Chan CC, Sen HN. Current concepts in Diagnosing and Managing Primary Vitreoretinal (Intraocular) Lymphoma. Discov Med. 2013;15(81):93–100. [PMC free article] [PubMed] [Google Scholar]
- 3.Hormigo A, Abrey L, Heinemann MH, et al. Ocular presentation of primary central nervous system lymphoma: diagnosis and treatment. Br J Haematol 2004;126(2):202–8. [DOI] [PubMed] [Google Scholar]
- 4.Kimura K, Usui Y, Goto H. The Japanese Intraocular Lymphoma Study Group. Clinical features and diagnostic significance of the intraocular fluid of 217 patients with intraocular lymphoma. Jpn J Ophthalmol. 2012;56(4):383–389. [DOI] [PubMed] [Google Scholar]
- 5.Cassoux N, Merle-Beral H, Leblond V, et al. Ocular and central nervous system lymphoma: clinical features and diagnosis. Ocul Immunol Inflamm 2000;8:243–250. [DOI] [PubMed] [Google Scholar]
- 6.Dalal M, Casady M, Moriarty E, et al. Diagnostic procedures in vitreoretinal lymphoma. Ocul Immunol Inflam 2014;22(4):270–276. [DOI] [PubMed] [Google Scholar]
- 7.Wang Y, Shen D, Wang VM, et al. Molecular Biomarkers for the Diagnosis of Primary Vitreoretinal Lymphoma. Int J Mol Sci 2011;12(9):5684–5697. [DOI] [PMC free article] [PubMed] [Google Scholar]
- 8.Dawson AC, Williams KA, Appukuttan B, Smith JR. Emerging diagnostic tests for vitreoretinal lymphoma: a review. Clin Exp Ophthalmol 2018. doi: 10.1111/ceo.13304. [DOI] [PubMed] [Google Scholar]
- 9.Rousset F, Garcia E, Peronne C, et al. Interleukin 10 is a potent growth and differentiation factor for activated human B lymphocytes. Proc Natl Acad Sci USA 1992;89(5):1890–1893. [DOI] [PMC free article] [PubMed] [Google Scholar]
- 10.Blay JY, Burdin N, Rousset F, et al. Serum interleukin-10 in non-Hodgkin’s lymphoma: a prognostic factor. Blood 1993;82(7):2169–74. [PubMed] [Google Scholar]
- 11.Murray PI, Hoekzema R, van Haren MA, et al. Aqueous humor interleukin-6 levels in uveitis. Invest Ophthalmol Vis Sci 1990;31(5):917–20. [PubMed] [Google Scholar]
- 12.Gabay C, Emery P, van Vollenhoven R, et al. Tocilizumab monotherapy versus adalimumab monotherapy for treatment of rheumatoid arthritis (ADACTA): a randomized, double-blind, controlled phase 4 trial. Lancet 2013;381(9877):1541–50. [DOI] [PubMed] [Google Scholar]
- 13.Wolf LA, Reed GF, Buggage RR, et al. Vitreous Cytokine Levels. Ophthalmology 2003;110(8):1671–1672. [DOI] [PubMed] [Google Scholar]
- 14.Buggage RR, Whitcup SM, Nussenblatt RB, et al. Using interleukin 10 to interleukin 6 ratio to distinguish primary intraocular lymphoma and uveitis. Invest Ophthalmol Vis Sci 1999; 40(10): 2462–2463. [PubMed] [Google Scholar]
- 15.Akpek EK, Maca SM, Christen WG, et al. Elevated vitreous interleukin-10 level is not diagnostic of intraocular-central nervous system lymphoma. Ophthalmology 1999;106(12):2291–5. [DOI] [PubMed] [Google Scholar]
- 16.Costopoulos M, Touitou V, Golmard JL, et al. ISOLD: A new highly sensitive interleukin score for intraocular lymphoma diagnosis. Ophthalmology 2016. [DOI] [PubMed] [Google Scholar]
- 17.Sugita S, Takase H, Sugamoto Y, et al. Diagnosis of intraocular lymphoma by polymerase chain reaction analysis and cytokine profiling of the vitreous fluid. Jpn J Ophthalmol 2009;53(3):209–214. [DOI] [PubMed] [Google Scholar]
- 18.Cawley GC, Talbot NLC. On over-fitting in model selection and subsequent selection bias in performance evaluation. J Mach Learn Res 2010 2010;11:2079–2107 [Google Scholar]
- 19.Youden WJ. Index for rating diagnostic tests. Cancer 1950;3(1):32–35 [DOI] [PubMed] [Google Scholar]
- 20.Koch DD, Hill W, Abulafia A, Wang L. Pursuing perfection in intraocular lens calculations: I. Logical approach for classifying IOL calculation formulas. J Cataract Refract Surg 2017;43(6):717–718. [DOI] [PubMed] [Google Scholar]
- 21.Chan CC. Molecular pathology of primary intraocular lymphoma. Trans Am Ophthalmol Soc 2003;101:275–292. [PMC free article] [PubMed] [Google Scholar]
- 22.Davis JL. Intraocular lymphoma: a clinical perspective. Eye 2013;27(2):153–162. [DOI] [PMC free article] [PubMed] [Google Scholar]
- 23.Cassoux N, Giron Alain, Bodaghi B, et al. IL-10 Measurement in Aqueous Humor for Screening Patients with Suspicion of Primary Intraocular Lymphoma. Invest Ophthalmol Vis Sci 2007; 48(7): 3253–3259. [DOI] [PMC free article] [PubMed] [Google Scholar]
- 24.Fission S, Ouakrim H, Touitou V, et al. Cytokine Profile in Human Eyes: Contribution of a New Cytokine Combination for Differential Diagnosis between Intraocular Lymphoma or Uveitis. PLoS One 2013; 8(2):e52385. [DOI] [PMC free article] [PubMed] [Google Scholar]
Associated Data
This section collects any data citations, data availability statements, or supplementary materials included in this article.


