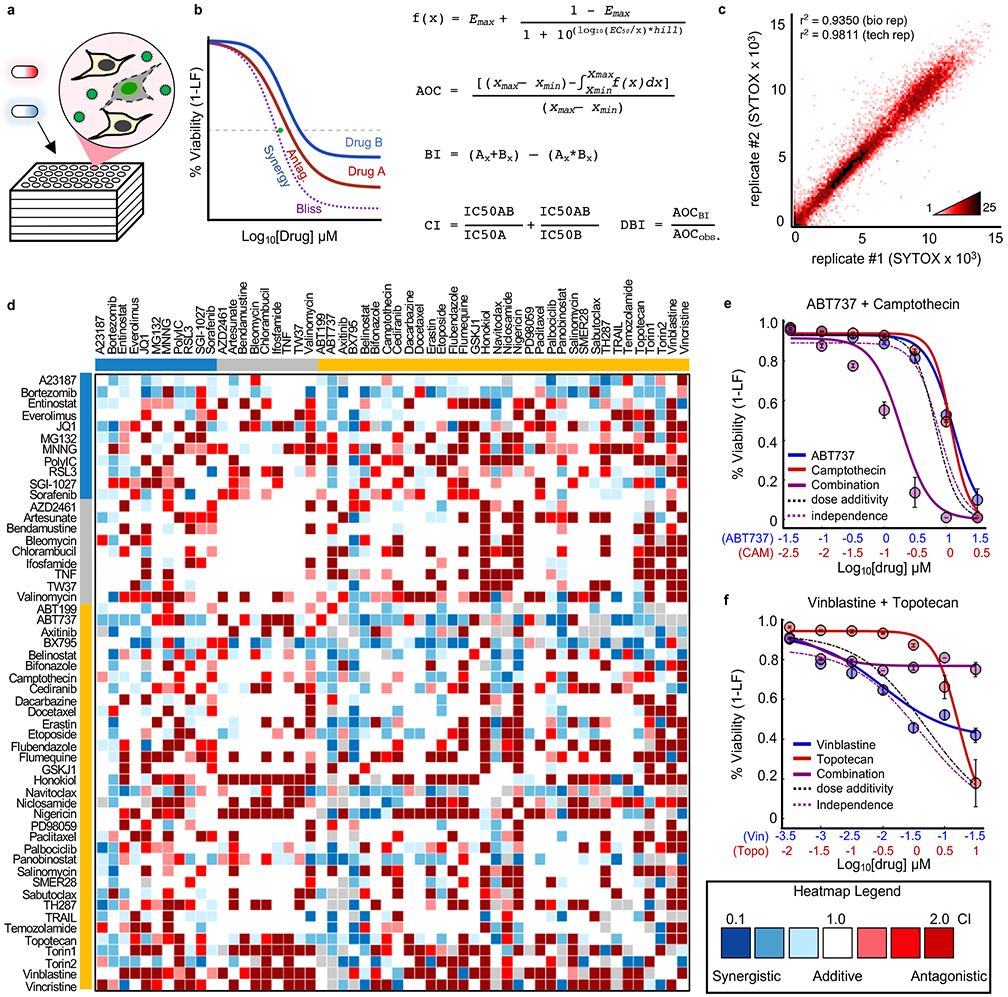
Figure 3 – Combination drug screen to evaluate co-activation of apoptotic and non-apoptotic death pathways.

(a) SYTOX assay for drug combinations. (b) Calculation of drug-drug interactions. Equations shown for calculating dose curves, expectation under Bliss Independence (BI), Combination Index (CI, green dot) and Deviation from Bliss Independence (DBI). (c) Density plot of replicates from drug combination screen. Pearson correlation coefficient shown for biological replicates (tested across different days, n = 2) and technical replicates (tested across multiple wells of a plate, n = 2). (d) Drug combination screen. Heatmap of all CIs determined from screening 54x54 drug combinations. Colored bars depict drug class: Blue – Non-apoptotic; Grey – non-lethal; Gold – apoptotic. See also Supplementary Fig. 6-7. (e-f) Examples of synergistic/antagonistic drug combinations. (e) ABT737 (blue) and camptothecin (red). (f) Vinblastine (blue) and topotecan (red). For (e) and (f) purple – observed combination; dashed black – predicted assuming dose additivity; dashed purple – predicted assuming drug independence. Data are mean +/− SD from biological replicates (n = 4).
