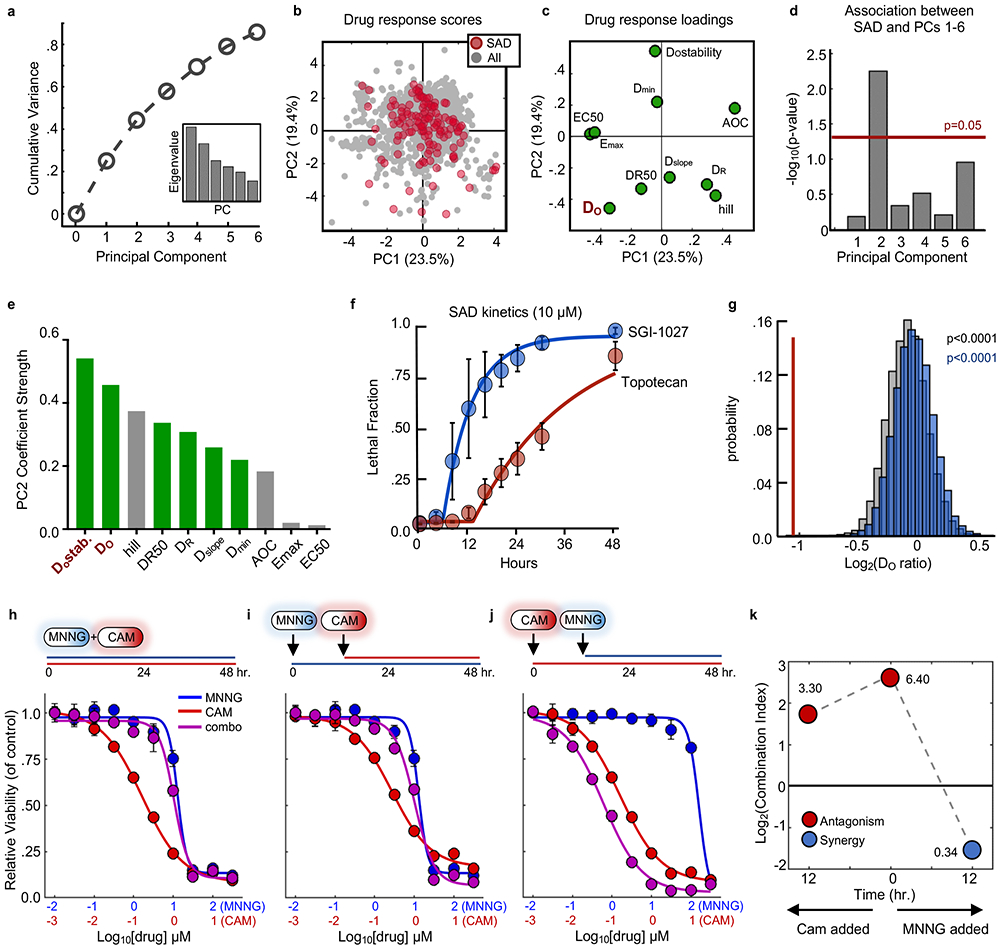
Figure 5 – Statistical modeling reveals death onset kinetics as a key determinant of SAD combinations.

(a) Cumulative variation captured by PC1-6. Inset – Eigenvalues for PC1-6. (b) PCA scores plot for all single drugs and combinations from the cell death screen. SAD combinations are colored red while all other combinations/drugs are colored grey. (c) Loadings plot for PCs 1 and 2. (d) Enrichment of SAD for PCs 1-6. Enrichment for each PC was calculated using a one-tailed Fisher’s exact test. For panels (b-d) data are from the drug combination screen shown in Figure 3 (54 single drugs; 1431 combinations; n = 4 biological replicates). (e) Absolute value of parameter loading coefficients on PC2. Green – rate metrics; Grey – pharmacological metrics. (f) LF kinetics for an example SAD combination. Blue – dominant drug; red – suppressed drug. (g) Distribution of average onset ratios for all combinations (grey), non-SAD combinations (blue), or SAD combinations (red). Empiric p-value calculated by bootstrapping 10,000 iterations of 130 random drug combinations. (h-j) Dose response functions for MNNG and camptothecin (CAM) combinations added simultaneously (h) or sequentially (i and j). Blue – MNNG; Red – CAM; Purple – combination. (k) Combination indices over time for MNNG + CAM. Red – antagonistic; blue – synergistic. For panels (f), and (h-j), data are mean ± S.D. from biological replicates (n = 4).
