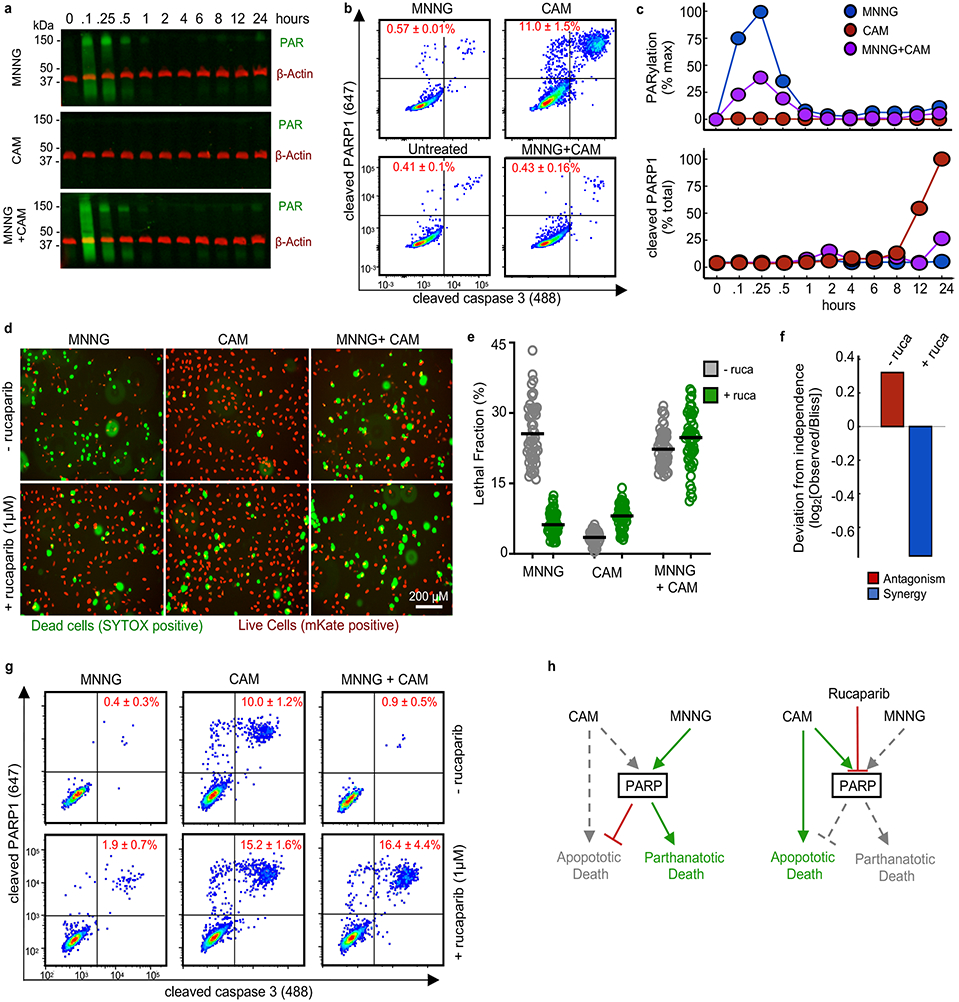
Figure 6 – PARP1-dependent interactions mediate single agent dominance and choice between parthanatotic or apoptotic death.

(a-c) Dynamics of drug-induced changes in PARP1 activity. Samples were treated with MNNG (31.6 μM), camptothecin (CAM, 3.16 μM), or MNNG+CAM for indicated times. (a) Representative Western blot of total protein PARylation. Green – total PAR; red – β-actin. Data are representative of 2 biological replicates. See also Supplementary Fig. 13a. (b) Cleaved-PARP1 quantified by FACS (12 hr. treatment shown). Data are % cleaved PARP1 as mean +/− SD from independent biological replicates (n = 2). (c) Quantification of PAR (top) and cleaved-PARP1 (bottom) activation dynamics. PAR quantified as % max signal. Cleaved PARP1 is shown as a percent of total cells. Data are the mean from independent biological replicates (n = 2). (d) Live cell imaging using STACK. U2OS cells expressing nuclear localized mKate2 (red) were treated with MNNG, CAM, or MNNG+CAM, +/− 1 μM rucaparib (ruca). Representative images from 48 hours post treatment from 2 independent replicates. Scale bars, 200 μm (e) Quantification of imaging in panel (d). Data are LF per image (50 images per condition). Line represents mean per treatment condition. (f) Deviation from expected response. Expected combination response calculated relative to Bliss independence using the quantified LF values from (e). (g) Apoptotic activity of MNNG+CAM. Cleaved-PARP1/cleaved-caspase3 quantified 12 hours after treatment. Data are the mean +/− SD from independent biological replicates (n = 4). (h) A model for a PARP mediated interaction between parthanatotic and apoptotic death leading to SAD.
