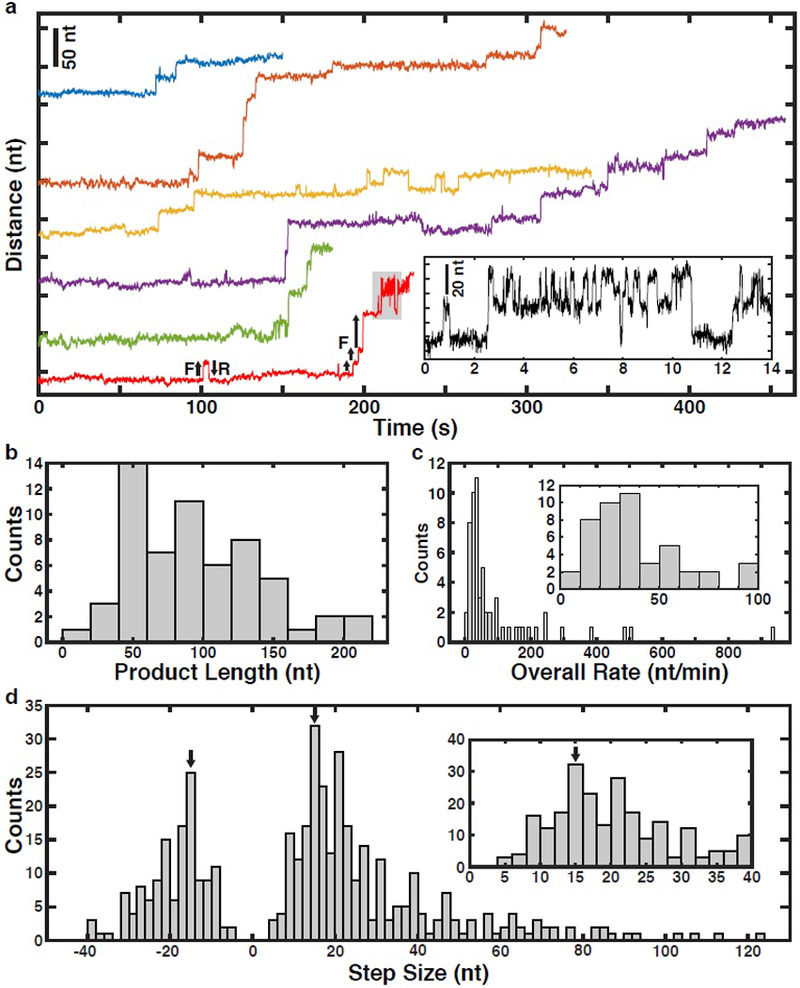
Figure 2. Telomerase releases multiple telomeric repeats in a single step.

a, Representative time trajectories (120 ms per data point) of telomerase catalysis after transfer into nucleotide containing buffer (t = 0) showing processive elongation, forward (F) and reverse (R) stepping. Inset: Zoom-in of region of bottom-most example trace (in red) corresponding to the region shaded gray. b, Distribution of total tether elongation by telomerase (n = 60 traces). c, Distribution of overall elongation rate for all telomerase elongation trajectories (n = 60 traces). Inset: zoom-in around the main peak of the overall rate distribution. d, Distribution of the observed tether elongation step sizes of telomerase trajectories (n = 60 distinct tethers, 417 steps total). Inset: zoom-in around the forward step distribution peak. Arrows mark a 15 nt magnitude step size which is the expected GQ folding and unfolding step size.
