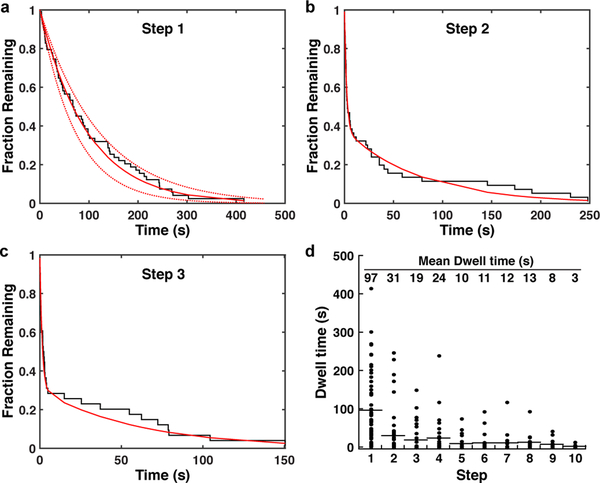
Figure 5. Dissociation from the anchor site controls product release by telomerase.
a-c, Inverse cumulative distribution of dwell times for the a first, b second, and c third step of all telomerase trajectories (black staircase, n = 60 traces). Solid red line indicates a single (a) or double (b,c) exponential fit, dashed lines the 90% confidence intervals. d, Dot plot of individual dwell times for the first 10 steps of all telomerase trajectories (n = 60). Mean dwell time is indicated at the top of the graph and by the black horizontal lines.

