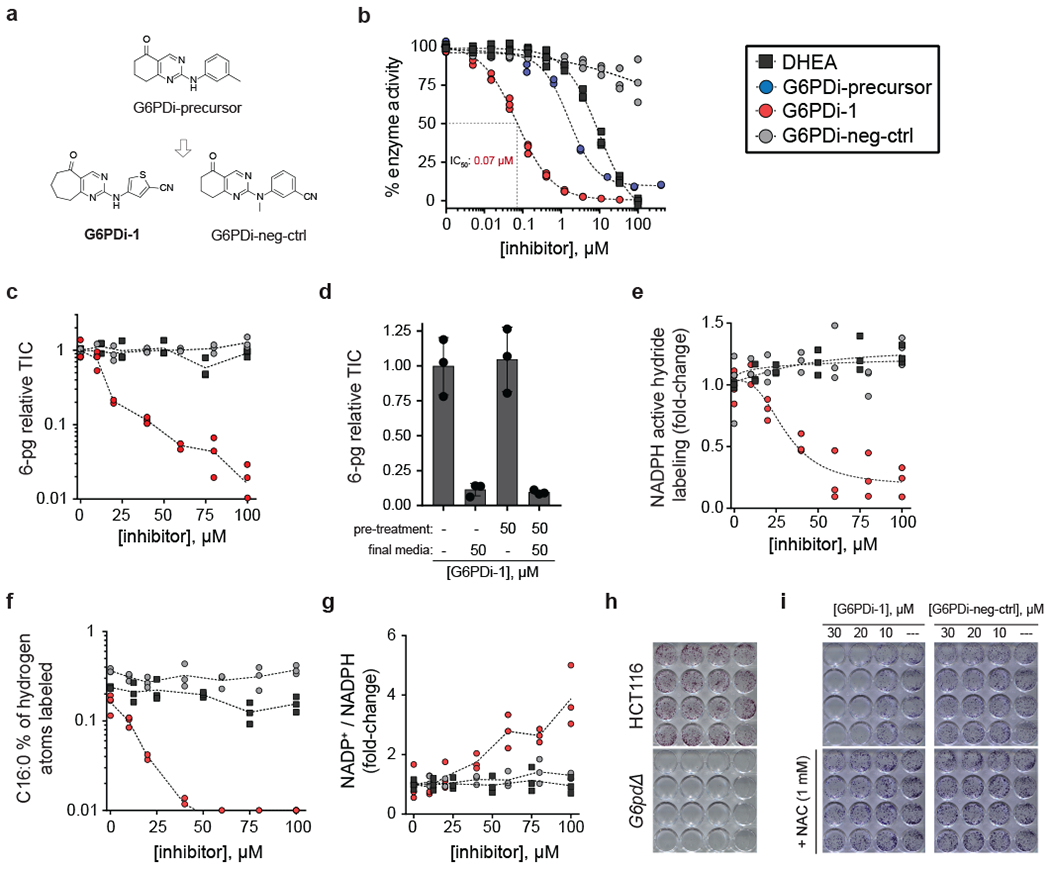
Figure 2. A non-steroidal, cell active inhibitor of G6PD.

a, Chemical structures. b, In vitro dose response curves (n = 3). c, 6-pg dose response curves (HepG2 cells) (n = 3). d, Reversibility of the cellular activity of G6PDi-1. HepG2 cells were pre-treated with indicated media for two hours, followed by incubation with final media for two hours (mean ± SD, n = 3). e, NADPH active hydride 2H-labeling dose response curves (HCT116 cells, [1-2H]-glucose tracer) n = 3). f, Free palmitic acid 2H-labeling dose response curves (HCT116 cells, [1-2H]-glucose tracer) (n = 3). g, NADP+/NADPH ratio dose response curves (HCT116 cells) (n = 3). h, Representative crystal violet staining of colonies formed from HCT116 and G6PD knockout cells. i, Colony formation of HCT116 cells treated with increasing doses of G6PDi-1 and G6PDi-neg-ctrl. Representative results of 3 independent experiments. NAC = N-acetylcysteine.
