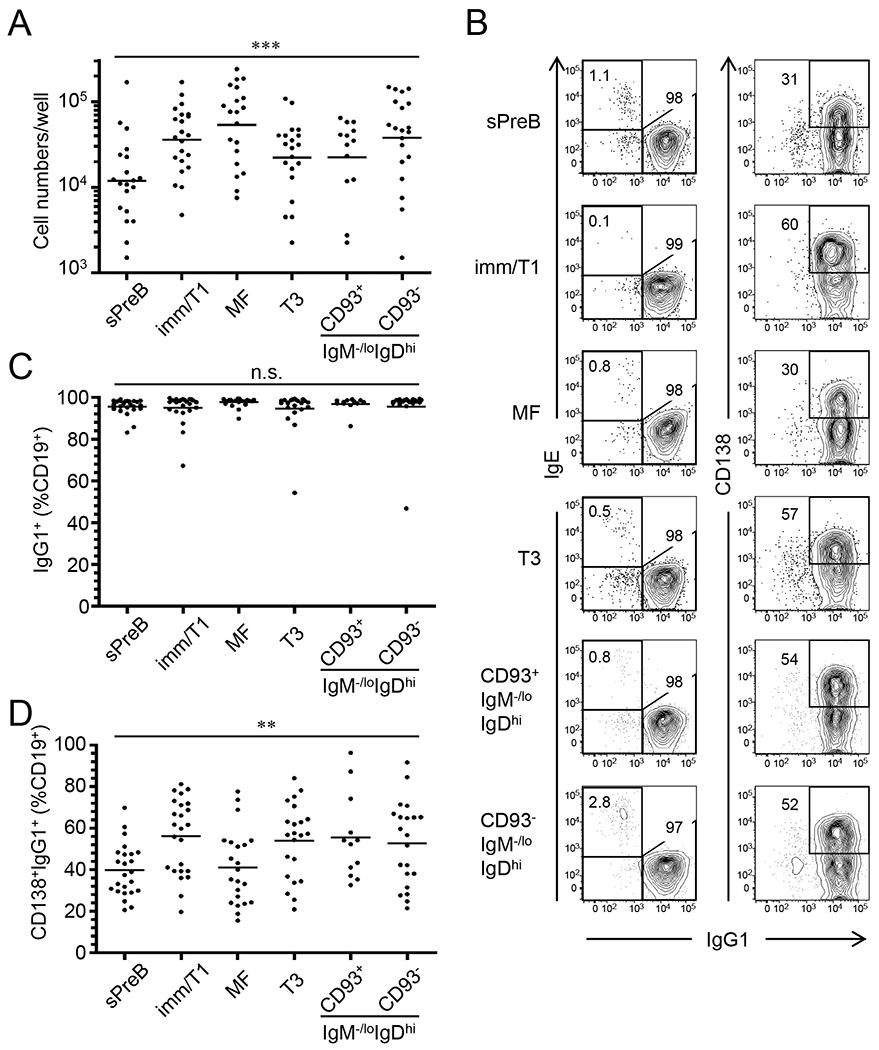
Figure 1. Nojima culture efficiently supports proliferation of single B cells, differentiation into IgG1+ plasmacytes and IgG secretion.

Single B cells were sorted from small pre-B (sPreB), immature/T1 (Imm/T1), mature follicular (MF), transitional-3 (T3), and CD93+ and CD93− anergic B cells of B6 mice (gatings are shown in Fig. S1), and then cultured in the presence of NB-21.2D9 feeder cells. Live B-cell numbers (A), representative FACS profiles of surface IgG1 and IgE or CD138 expression on CD19+ cells (B), and frequencies of IgG1+ cells (C) and CD138+IgG1+ cells (D) in CD19+ cells of indicated B-cell subsets after 8 days of Nojima cultures are shown. Each symbol in (A, C, and D) represents individual wells (n = 12-24) and bars indicate geometric mean of the samples. n.s., P > 0.05; **, P < 0.01; ***, P < 0.001 determined by Kruskal-Wallis test. Numbers within or close to gatings in each panel of (B) indicate the frequency of cells within gatings.
