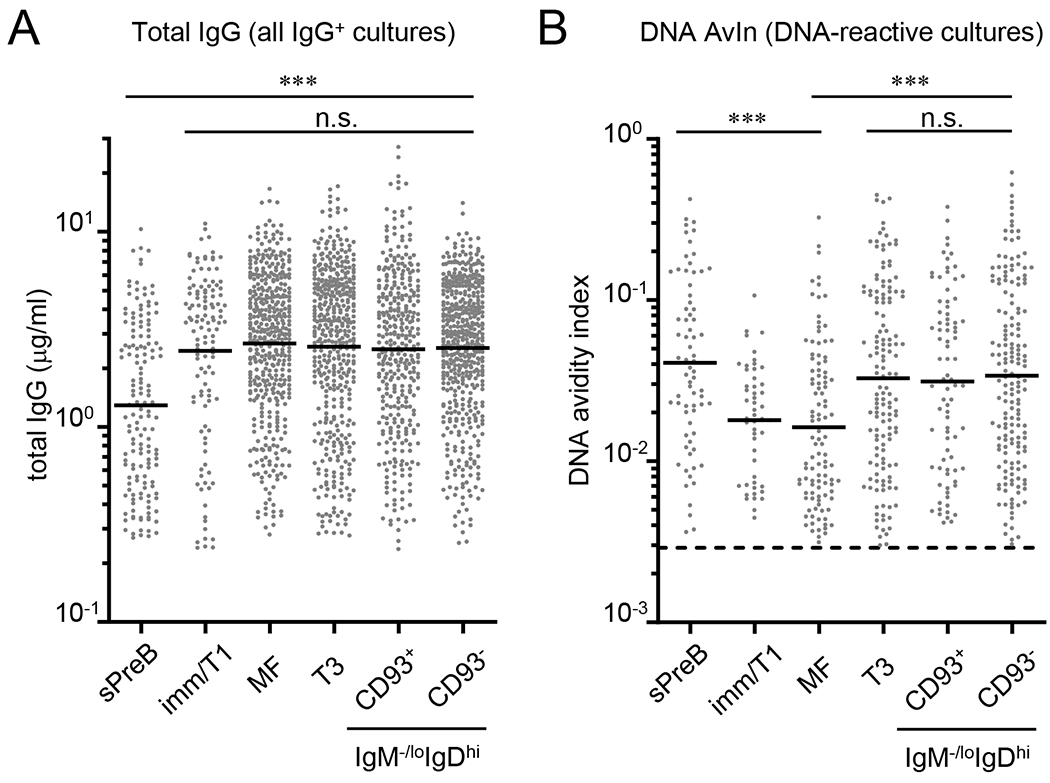
Figure 2. DNA-reactive B cells with higher avidity are purged in bone marrow but enriched in anergic B-cell compartments in the spleen of normal mice.

Clonal IgGs were obtained by Nojima cultures (9 days) of small pre-B (sPreB, n = 153), immature/T1 (Imm/T1, n = 120), mature follicular (MF, n = 440), transitional-3 (T3, n = 447), and CD93+ (n = 362) and CD93- (n = 499) anergic B cells from B6 mice. Concentrations of total IgG (A) and DNA AvIns (B) of each sample were determined by ELISA. Distributions of total IgG concentrations (A) and DNA AvIns (B) are shown. (B) DNA AvIns were calculated by taking the ratio of concentrations of DNA-binding IgG to total IgG (detailed in Experimental procedures). Dotted line indicates DNA AvIn (=0.0029) of non-autoreactive mAb [H33Lγ1; (32)] and therefore set as a cut-off for the determination of DNA reactivity. DNA-reactive samples among all IgG+ samples are shown. Each symbol represents individual wells and bars indicate geometric mean of the samples. Combined data from two independent experiments are shown. n.s., P > 0.05; ***, P < 0.001 determined by Kruskal-Wallis test.
