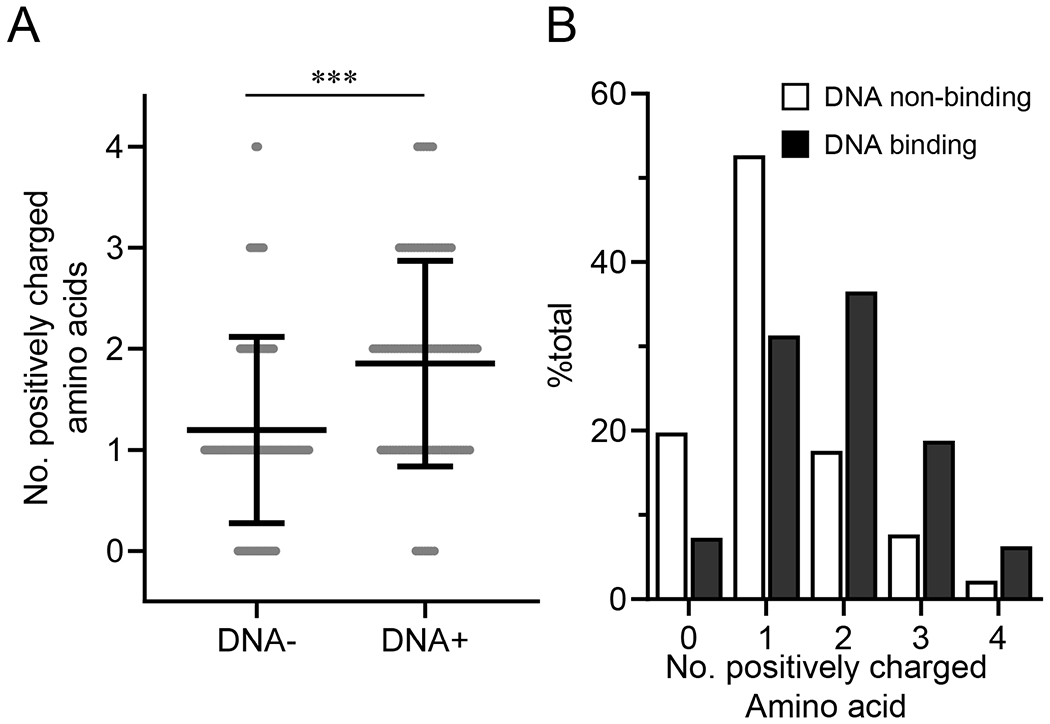
Figure 4. Somatic genetics of DNA-reactive B cells.

After Nojima cultures, VDJ rearrangements were amplified from cDNA samples of small pre-B (n = 45), T3 (n = 49), MF (n = 47), and CD93−IgM−/loIgD+ anergic B cells (n = 46). Data were combined and then sorted based on DNA reactivity of the corresponding culture supernatant IgGs (Table S1). (A) Number of positively charged amino acids (arginine, histidine, and lysine) within HCDR3 region was compared between DNA reactive (n = 96) and unreactive (n = 91) samples. Each symbol represents each sequence sample. Mean ± SD of samples is indicated. ***, P < 0.001 by Mann-Whitney’s U test. (B) Frequency distributions of the number of positively amino acids within HCDR3 of DNA-reactive (closed bars) and unreactive (open bars) samples described in A are shown.
