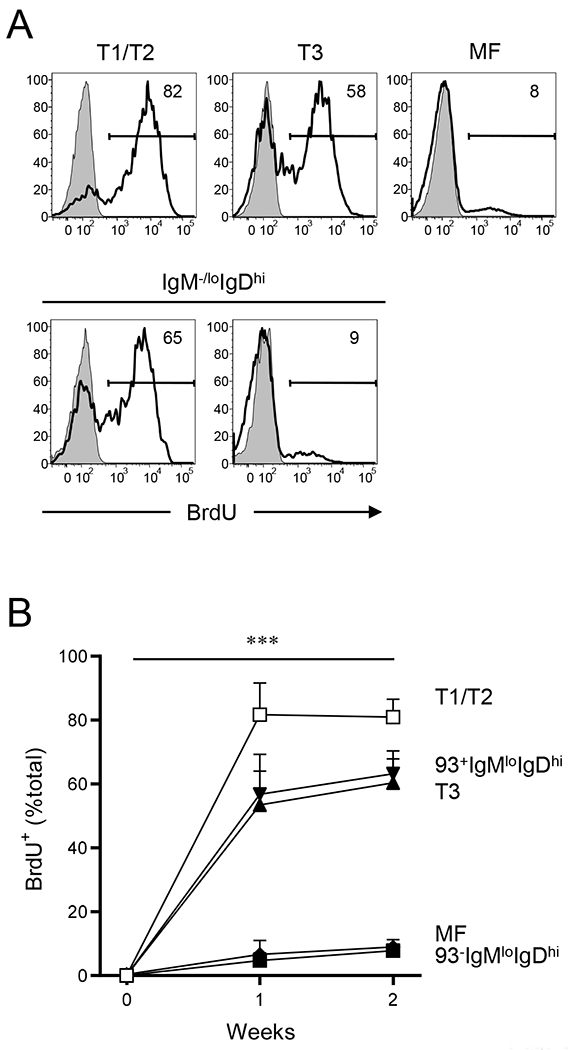
Figure 5. CD93-IgM−/loIgDhi B cells are persistent in spleen.

Turnover of B-cell subsets in spleen was compared by BrdU incorporation. B6 mice were fed BrdU in drinking water for up to 2 weeks, and BrdU incorporation in each B-cell subset was determined by flow cytometry. (A) Representative flow diagrams for BrdU labeling in indicated B-cell subsets are shown. Background for BrdU labeling (shaded histograms) was determined for each B-cell subset by labeling splenic B-cell compartments from untreated mice. Numbers in each flow diagram indicate percentage of BrdU+ cells. (B) Kinetics of the BrdU+ cells (% total) is shown. Data represent average ± SD (n = 5); T1/T2 (open squares), T3 (filled triangles), CD93+ (filled reverse triangles) and CD93− anergic (AN) B cells (filled diamonds), and MF B cells (filled squares). Statistical significance was determined using Turkey’s multiple comparison test in a mixed effects model with Geisser-Greenhouse correction. ***, P < 0.001. No statistical significance was observed among T1/T2, T3, and CD93+IgM−/loIgDhi B cells or between MF and CD93−IgM−/loIgDhi B cells.
