
Figure 6. Transient and persistent self-reactive B cells show different degree of impaired calcium responses in response to BCR activation.
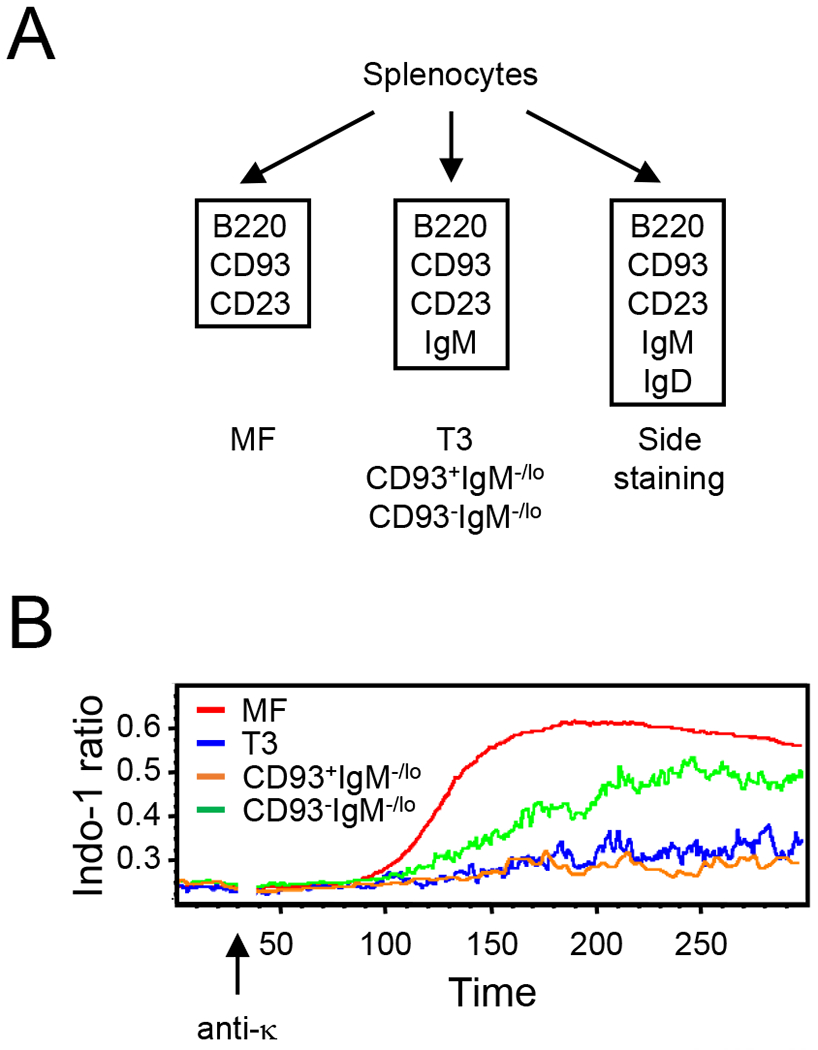
Analysis of intracellular calcium concentrations in B-cell subsets after stimulation with anti-kappa. (A) To mitigate impact of surface IgM and IgD labeling on the calcium responses, we sampled MF B cells (B220hiCD93−CD23+) that express intermediate levels of surface IgM from the staining panel without IgM (left). T3 (B220loCD93+IgM−/loCD23+), and CD93+ and CD93− anergic (B220+IgM−/loCD23+) B cells were sampled from staining panel with anti-IgM (middle). Side staining for IgD (right) revealed that MF, T3, and CD93+ and CD93− anergic B cells defined above contained IgD+ cells at 99%, 90%, 88%, and 96%, respectively (data not shown). (B) Representative kinetic graph of average MFI ratio (396 nm/496 nm) for MF (red), T3 (blue), and CD93+ (orange) and CD93− (green) anergic B cells. Anti-kappa was added to each sample at 30 s. Similar results were obtained from two independent experiments.