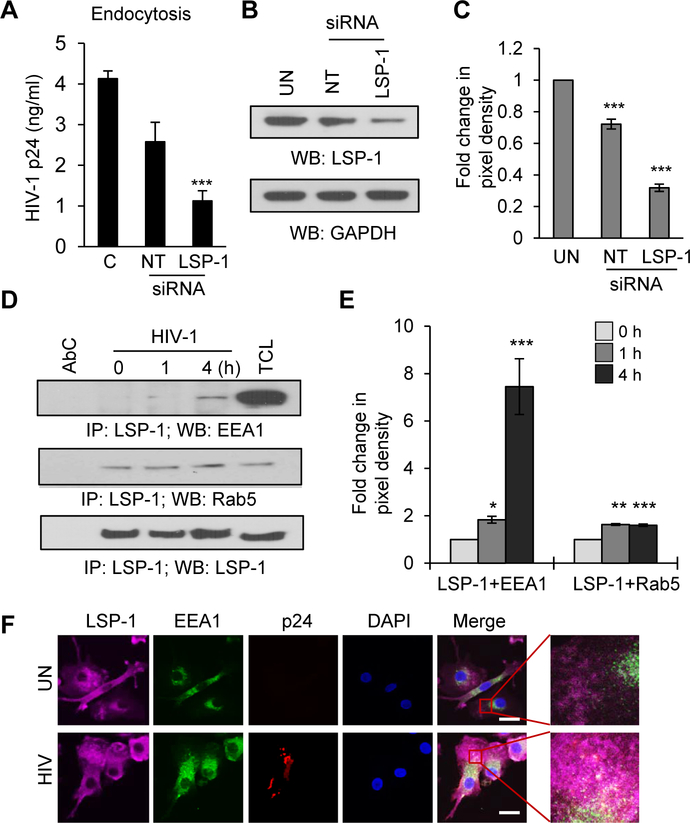
Figure 3: LSP1 mediates HIV-1 endocytosis in DCs.
(A) Untreated DCs and DCs transfected with NT-siRNAs or LSP1-specific siRNAs were incubated with HIV-1 BaL as described in Methods. The cells were lysed and analyzed for p24 using ELISA. Data represent the mean ± SEM of 3 experiments (C=control, NT=non-targeted). (B) Representative Western blots analysis of LSP1 expression in untreated DCs (UN) and in DCs transfected with NT-siRNAs (NT) or LSP1-specific (LSP1) siRNAs. GAPDH served as a loading control. (C) Quantitative analysis of the Western blots in (B). The band intensity in each lane was determined by Image J software. The fold change was determined by considering value of un-transfected control (UN) as 1. Data represent the mean ± SD of 3 independent experiments. (D) DCs were incubated with HIV-1 BaL (10ng/ml) for indicated time points (0–4 hours); lysed and immunoprecipitated with anti-LSP1 antibody. Interactions of LSP1 with EEA1 and Rab5 were analyzed by Western blotting. LSP1 was used as loading control. AbC – antibody control; TCL - total cell lysate. (E) Quantitative analysis of the Western blots of LSP1/EEA1 and LSP1/Rab5 interactions. The band intensity in each lane was determined by Image J software. The fold change was determined by considering value of untreated control (0) as 1. Data represent the mean ± SD of 3 independent experiments. (F) Confocal images of LSP1/EEA1/HIV-1 p24 interaction in DCs incubated with or without HIV-1 for 2 hours. Scale bars = 10 μm.

