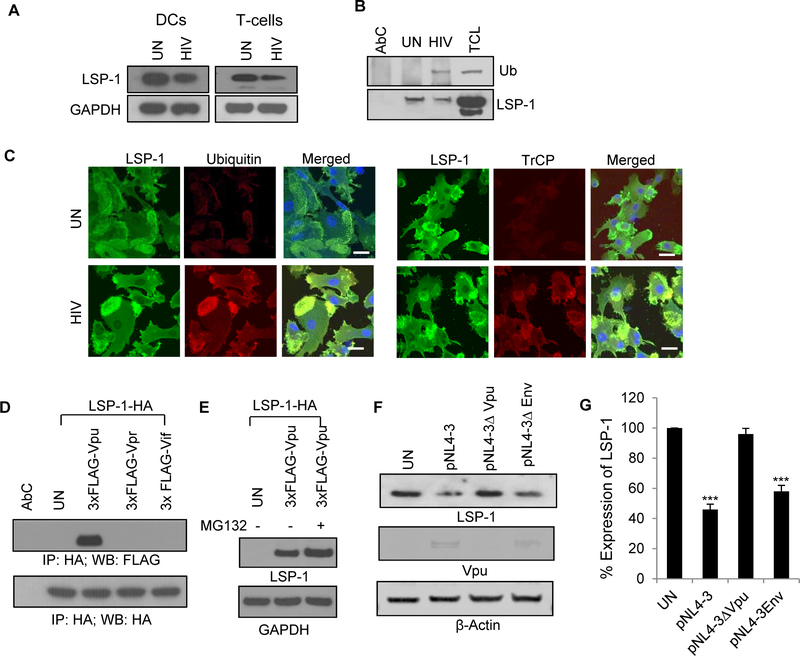
Figure 5: Degradation of LSP1 by HIV-1.
(A) Cell lysates from DCs or T-cells incubated with or without HIV-1 BaL (20ng/ml) for 24 hours were analyzed for LSP1 expression by Western blot analysis. GAPDH served as a loading control. (B) DCs were incubated with or without HIV-1 BaL (20ng/ml) for 24 hours; lysed and immunoprecipitated with anti-LSP1 antibody. Interaction of LSP1 with Ubiquitin (Ub) was analyzed by Western blotting. LSP1 was used as loading control. AbC – antibody control; TCL - total cell lysate. (C) Confocal images of LSP1/Ubiquitin (left panel) and LSP1/β-TrCP (right panel) interactions in DCs incubated with or without HIV-1 for 24 hours. Scale bars = 10 μm. (D) 293T cells were co-transfected with HA tagged LSP1 (LSP1-HA) with FLAG-tagged Vpu (3xFLAG-Vpu) or Vpr (3xFLAG-Vpr) or Vif (3xFLAG-Vif); lysed and immunoprecipitated with anti-HA antibody. Interactions of LSP1 with Vpu, Vpr and Vif were analyzed with anti-FLAG antibody. HA was used as loading control. (E) Cell lysates from 293T cells co-transfected with 3xFLAG-Vpu and LSP1-HA cultured with or without proteasome inhibitor MG132 were analyzed for LSP1 expression by Western blot analysis. GAPDH served as a loading control. (F-G) DCs were nucleofected with infectious molecular clone pNL4–3 or pNL4–3ΔVpu or pNL4–3ΔEnvEGFP, and LSP1 expression levels were analyzed by Western blotting. The band intensity was quantitated by using ImageJ software and percent expression was calculated by considering untreated (UN) as 100%. Results are representative of 3 independent experiments.

