FIG 2.
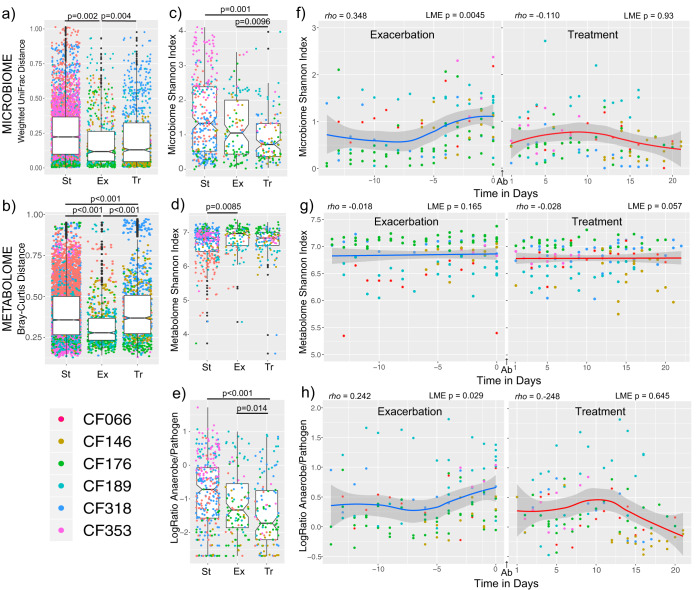
The microbiome and metabolome variation around CFPEs. (a and b) Notch plots of the (a) microbiome weighted UniFrac distances and (b) metabolome Bray-Curtis distances between samples classified as CFPE (−14 days from antibiotic treatment), treatment (during 21 days of antibiotic treatment), or stable (outside these time periods). Statistical significance across the class comparisons was tested using an LME model with subject as random effects and Tukey’s post hoc tests. (c and d) Shannon index of microbiome diversity (c) and metabolome diversity (d) in samples collected during different disease states. Statistical significance across the class comparisons was tested using an LME model with subject as random effects and Tukey’s post hoc tests. (e) Notch plots of the log ratios of anaerobes to pathogens in samples classified as CFPE, treatment, or stable. (Statistics are presented as described above). (f and g) Shannon index of microbiome diversity (f) and metabolome diversity (g) through the 14 days prior to a CFPE and the 21 days of treatment. Spearman’s rho and the corresponding P value from an LME model are shown for the regression with time in days. (h) Log ratio of anaerobes to pathogens through the 14 days prior to a CFPE and the 21 days of treatment. (Statistics are presented as described for panel f). Antibiotics were administered between day 0 and day 1 (denoted as “Ab” in panels f to h). All exacerbations for all subjects are shown in the plots.

