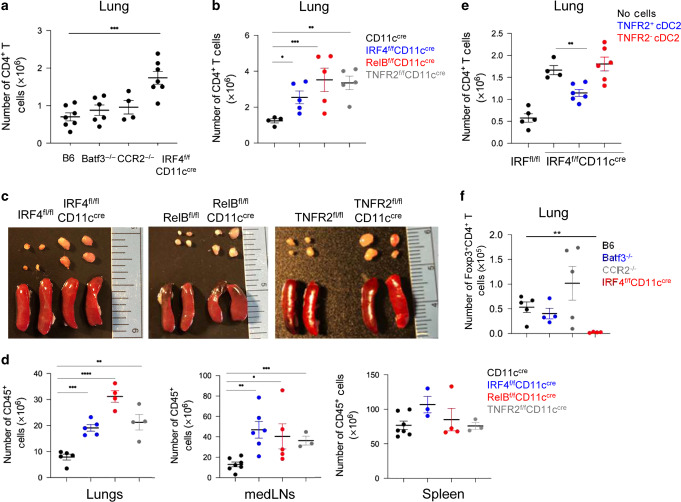
Fig. 1. The lung TNFR2+ cDC2 population maintains lung tolerance and prevents lung inflammation at steady state.
a Numbers of lung CD4+ T cells at steady state in C57BL/6 J (n = 7), Batf3−/− (n = 6), CCR2−/− (n = 4), and IRF4fl/flCD11ccre (n = 7) mice. Data were compiled from two independent experiments. b Numbers of lung CD4+ T cells in WT (n = 12), IRF4fl/flCD11ccre (n = 10), RelBfl/flCD11ccre (n = 7), and TNFR2fl/flCD11ccre (n = 5) mice at steady state. Data were representative of two independent experiments. c Image of mediastinal lymph nodes (mLNs; top) and spleens (bottom) in of 7- to 8-week-old knockout strains at steady state; n = 3 mice/group. Data are representative of two independent experiments. d Numbers of CD45+ cells in the lungs (left), mLNs (center), and spleens (right) in the indicated strains at steady state; n = 3 mice/group. Data were representative of two independent experiments. e Numbers of CD4+ T cells in IRF4fl/flCD11ccre mice 14 days post cell adoptive transfer. TNFR2+ or TNFR2− cDC2 were sorted from WT mice lung and intranasally (i.n.) transferred into IRF4fl/flCD11ccre recipient mice; n = 4–6 mice/group. Data are representative of two independent experiments. f Numbers of lung Foxp3+CD4+ T-reg cells at steady state in C57BL/6 J, Batf3−/−, CCR2−/−, and IRF4fl/flCD11ccre mice; n = 4–5 mice/group. Data were representative of two independent experiments. Graphs represent the mean with error bars indication s.e.m. P values determined by one-way ANOVA Tukey’s multiple comparison test. *P < 0.05, **P < 0.001, and ***P < 0.0001.

