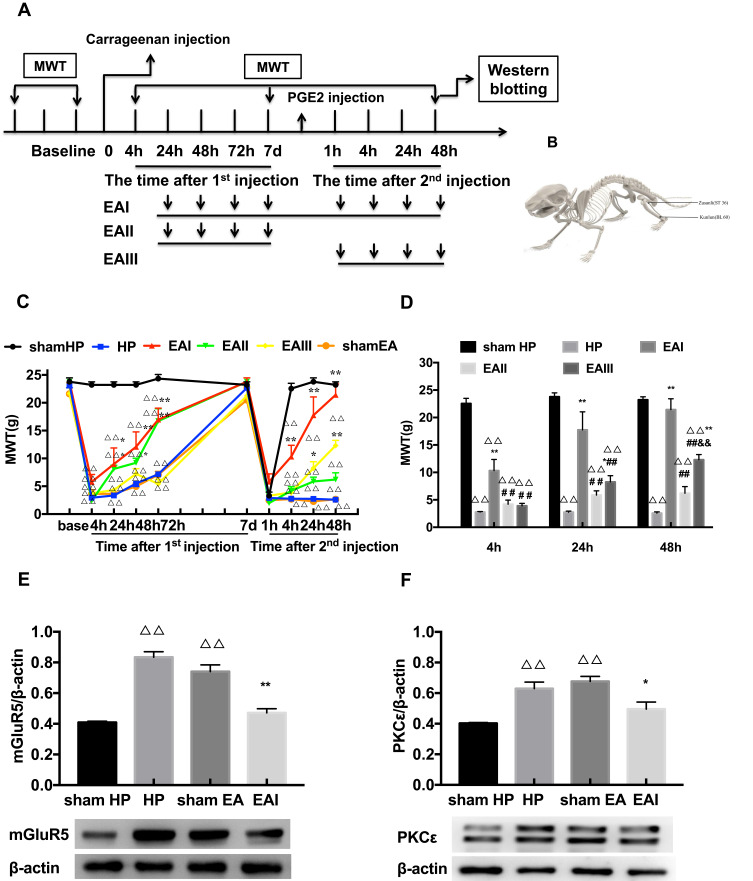
Figure 3.
(A) The procedure of EA stimulation experiment. (B) Schematic picture of the locations of the acupoints ST36 and BL60 in rat. (C) The analgesic effect of EA stimulation on the hyperalgesic priming rats. (D) Different time points of EA stimulation exerted comparable effects on MWT. (E, F) Western blotting images and relative protein level of mGluR5 and PKCε in rat L4-6 DRG from different groups. Date are mean ± SEM; n = 6; ΔΔP<0.01 vs sham HP group; **P<0.01, *P<0.05 vs HP group; ##P<0.01 vs EAI group; &&P<0.01, vs EAII group.

